7. Working with Dashboards
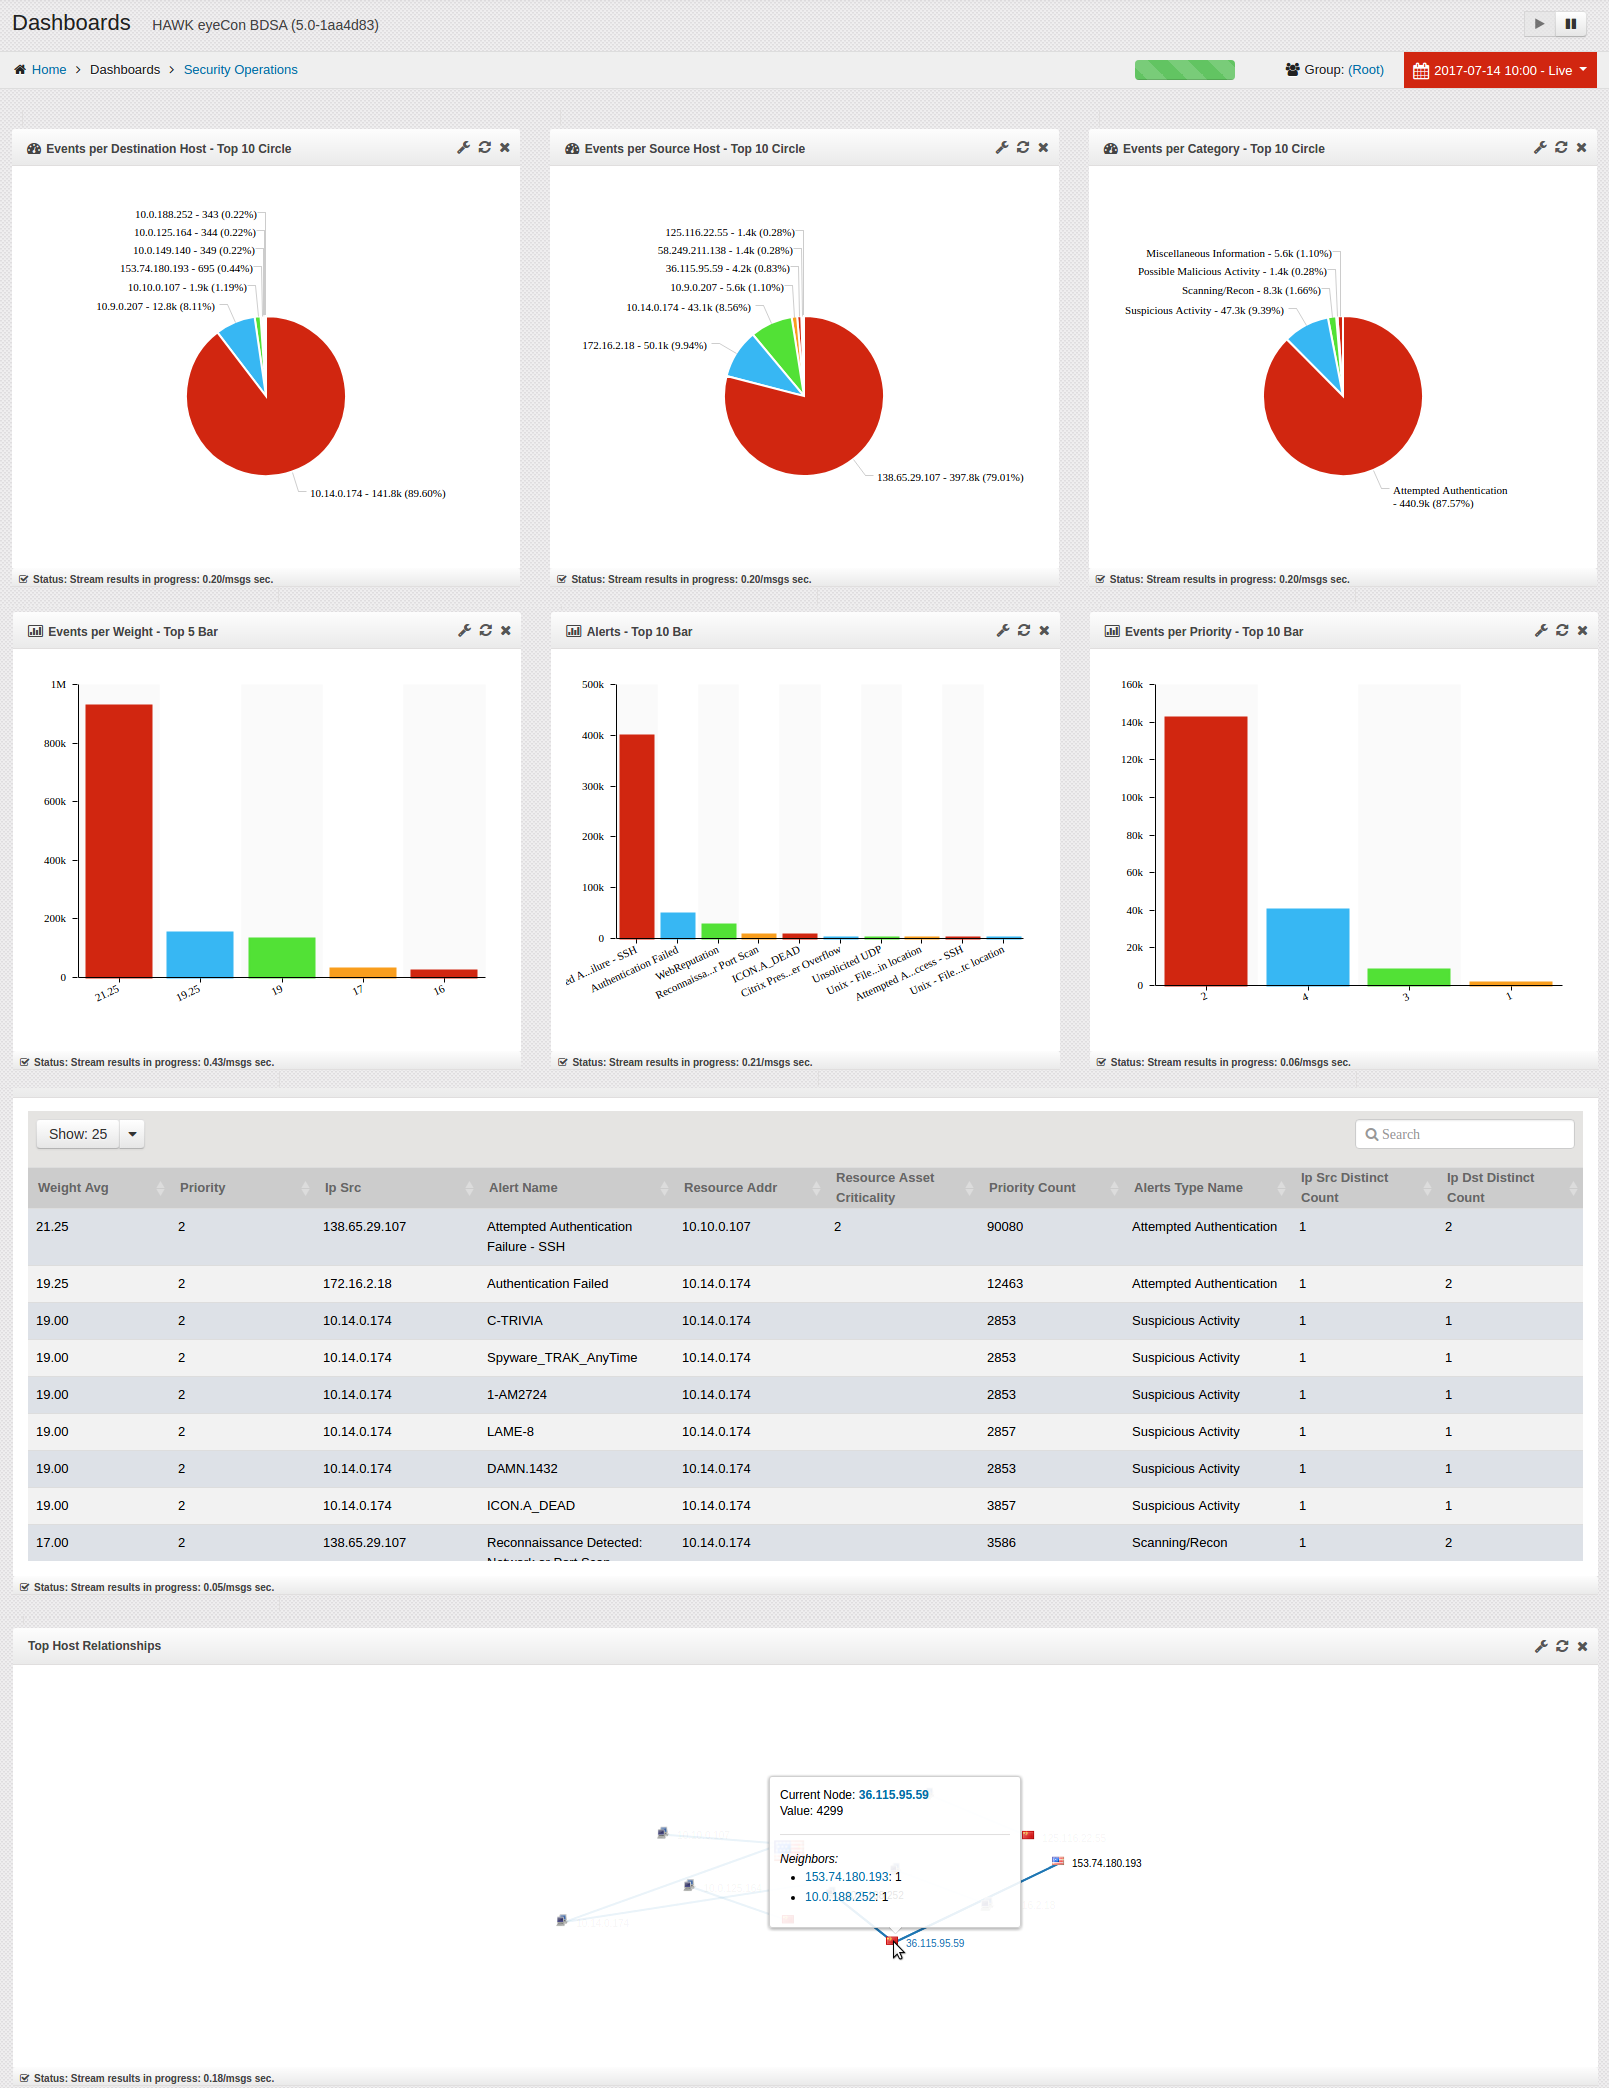
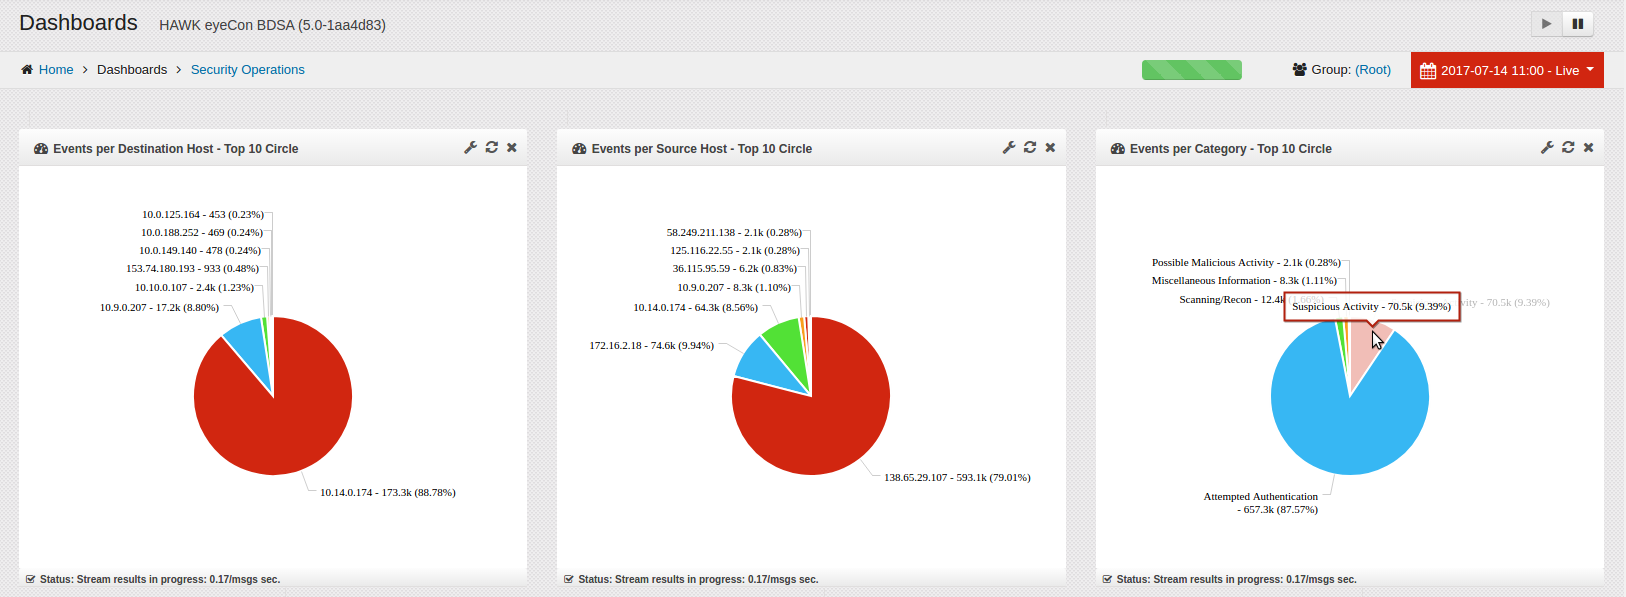
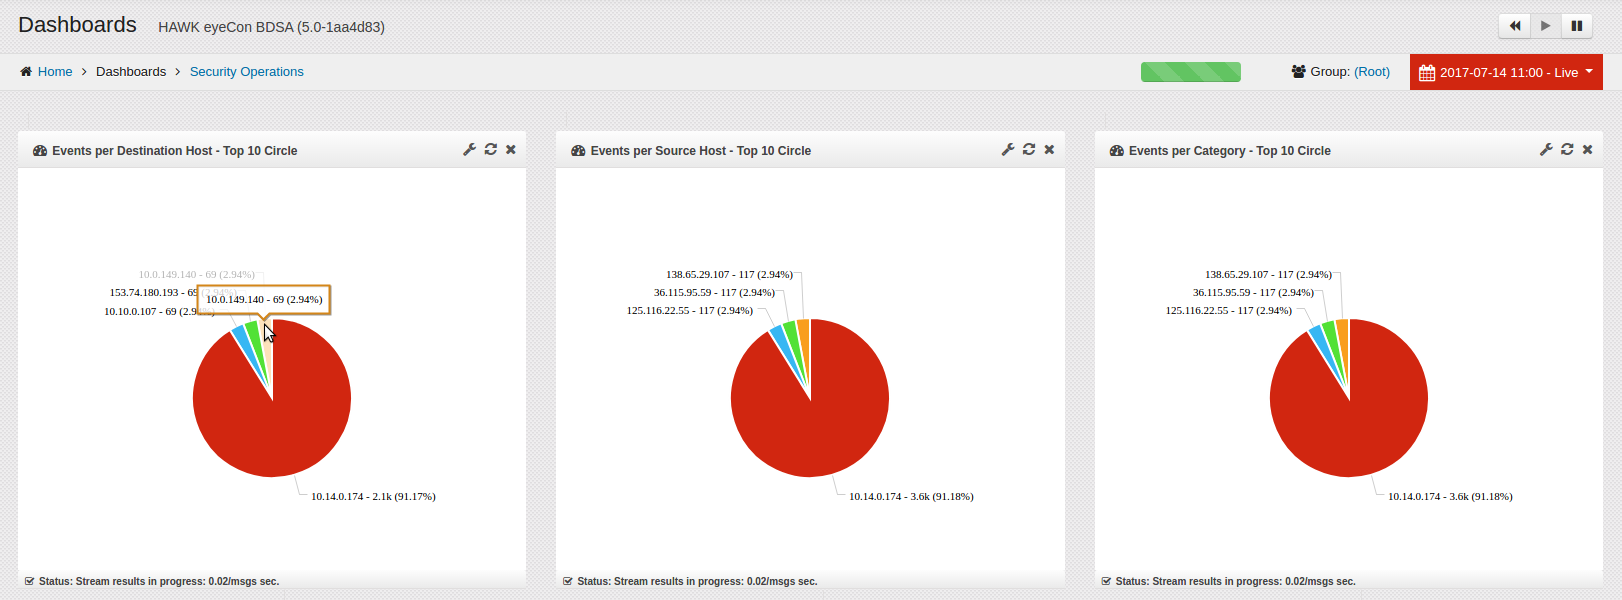
The full Dashboard is shown when the logon process completes. This dashboard allows the analyst to identify, track, and manage intrusions into the system. A sample of a full Dashboard is shown:
There are several Dashboards, which are created at installation and shown in the navigation panel, which include:
Executive
Compliance
Security Operations
Vulnerability
Numerous other Dashboard views can be created depending on the type of information needed. For example a Technical, a Performance, or other Dashboard types can be created by the user at any time. To change the Dashboard for viewing any specific style, simply click on in the navigation panel to expand the selection, then click on the desired Dashboard in the navigation panel. The information displayed in each of these individual Dashboards is specifically designed to meet the needs of the user. For example, the sample shown on the above is an Security Operations Dashboard.
Notice on this sample, there are eight individual widgets (graphics) displayed on this sample, each designed to serve a single purpose, and each of which can be tailored to meet the needs of the client. The widgets can be shown as pie charts, bar charts, line graphs - whichever format is most meaningful to the user.
The individual widgets on this sample include:
Events per Destination Host - Top 10 Circle
Events per Source Host - Top 10 Circle
Events per Category - Top 10 Circle
Events per Weight - Top 5 Bar
Alerts - Top 10 Bar
Events per Priority - Top 10 Bar
Prioritized Security Events
Top Host Relationships
Even though these are shown in the Security Operations Dashboard as default Widgets, others can be created as needed. Additionally, the widgets can be moved around and resized on the Dashboard for the user’s convenience. The following section identifies the different Dashboards.
7.1. Understanding the Dashboards
Since there are a variety of Dashboards that can be created, this section depicts some of the default Dashboards as well as some custom ones that can be defined as needed.
7.1.1. Default Dashboard - Executive
One of the default Dashboards which can be selected is the Executive Dashboard.
To select the Executive Dashboard, click on .
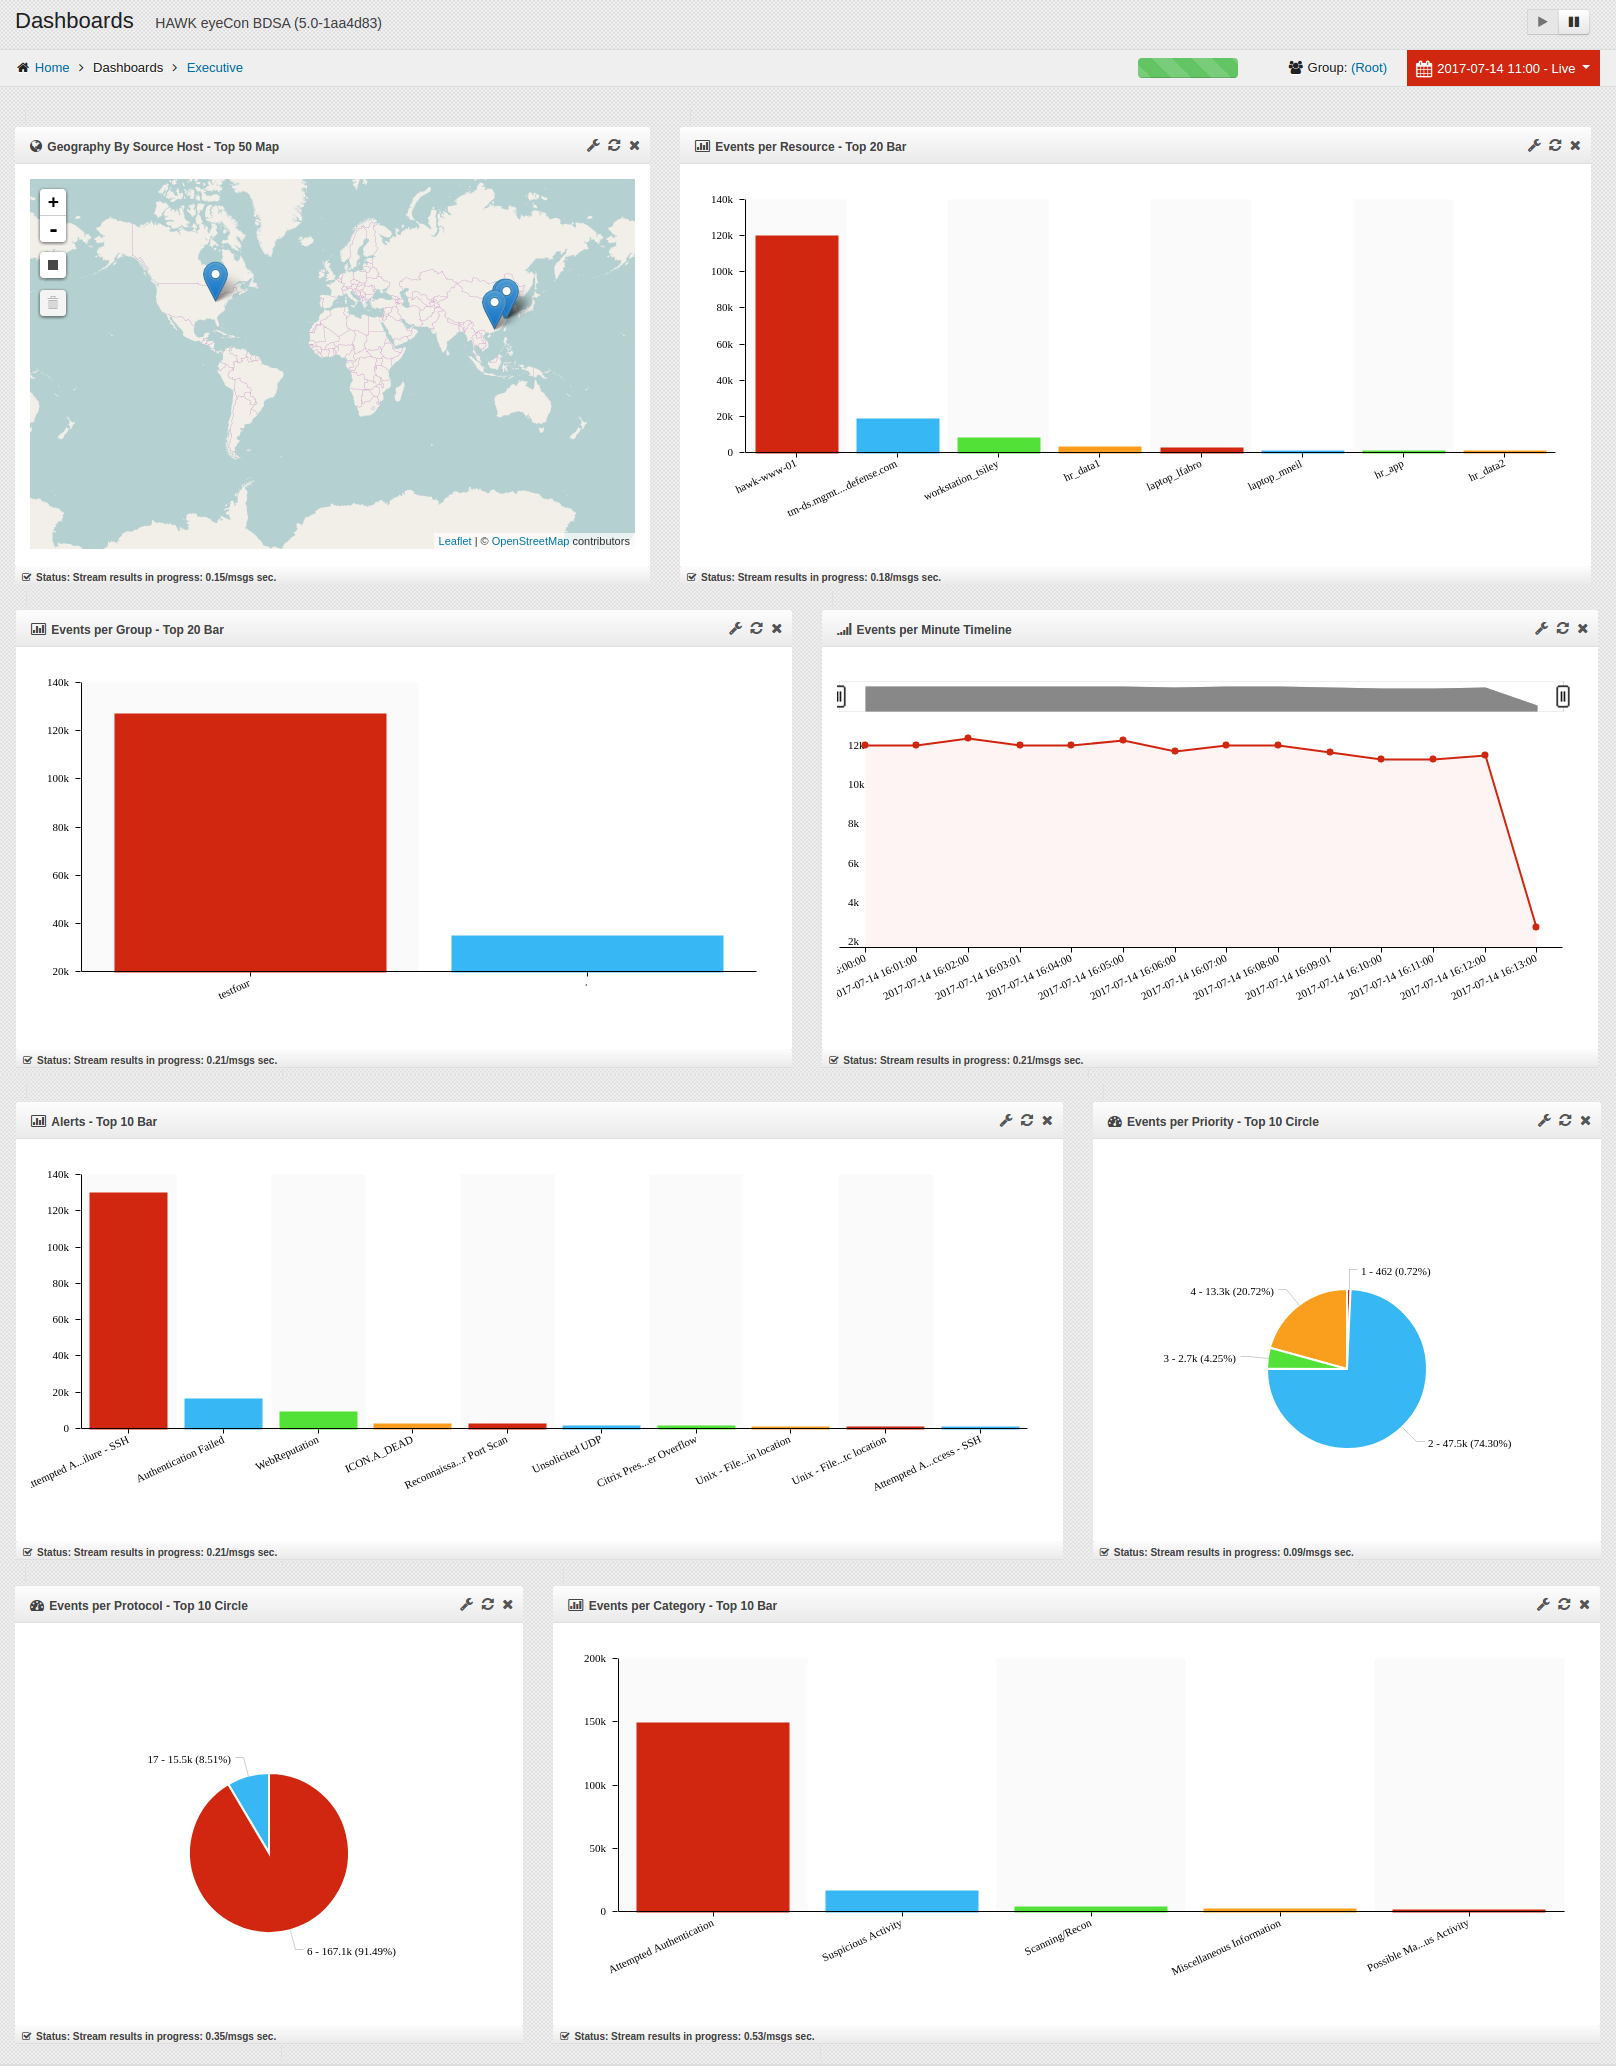
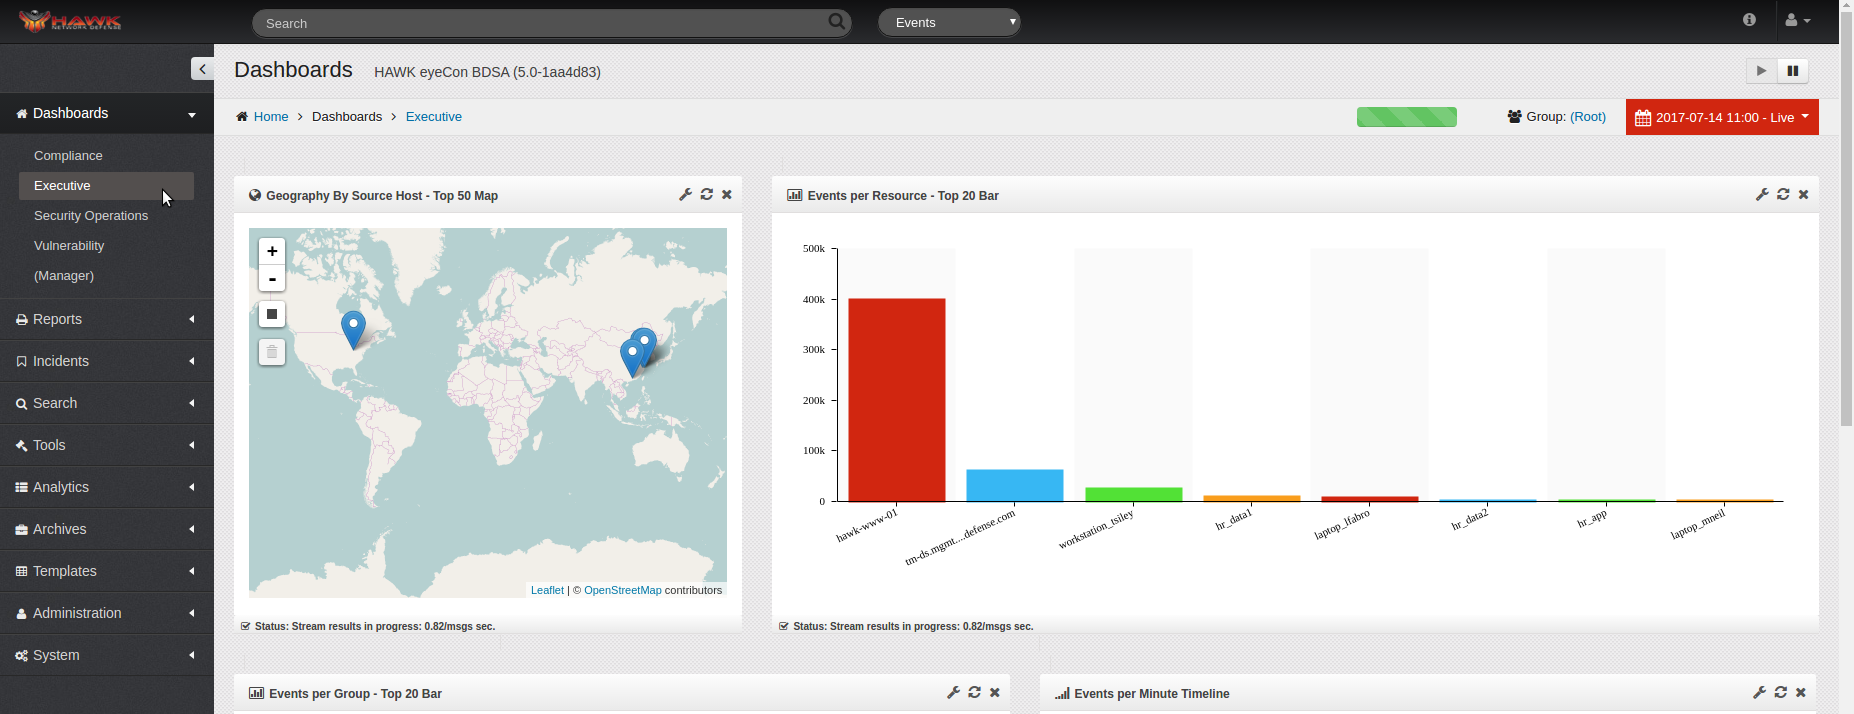
When the Executive Dashboard loads, by default it contains the following widgets:
Geography by Source Host - Top 50 Map
Events per Resource - Top 20 Bar
Events per Group - Top 20 Bar
Events per Minute - Timeline
Alerts - Top 10 Bar
Events per Priority - Top 10 circle
Events Per Protocol - Top 10 Circle
Events per Category - Top 10 Bar
These widgets can be moved around simply by clicking on the title bar of the widget and dragging it to the desired location, and dropping it.
Also, the representation of the data in the widget can be changed by clicking on the widget and selecting pie, bar, line, etc.
Additional Widgets can be added to this Dashboard, and the current Widgets can be closed (which is temporary until the Dashboard is opened again), or it can be deleted from the dashboard by using the Dashboard Manager.
7.1.2. Custom Dashboards
There are a variety of Dashboards that can be created and customized, depending on the needs of the users. For example, another Dashboard which can be created is a Vulnerability Dashboard, which alerts the analyst to specific resources in the environment which are susceptible to intrusions. All of the custom Dashboards appear in the navigation panel along with the default Dashboards.
Note
The Vulnerability Dashboard obtains its data from vulnerability scans. Because this data is not real-time the vulnerability dashboard performs different then Dashboards driven by event data. The latest vulnerability data will show regardless of the timeframe selected.
If the Vulnerability Dashboard has been created, to view it, click on
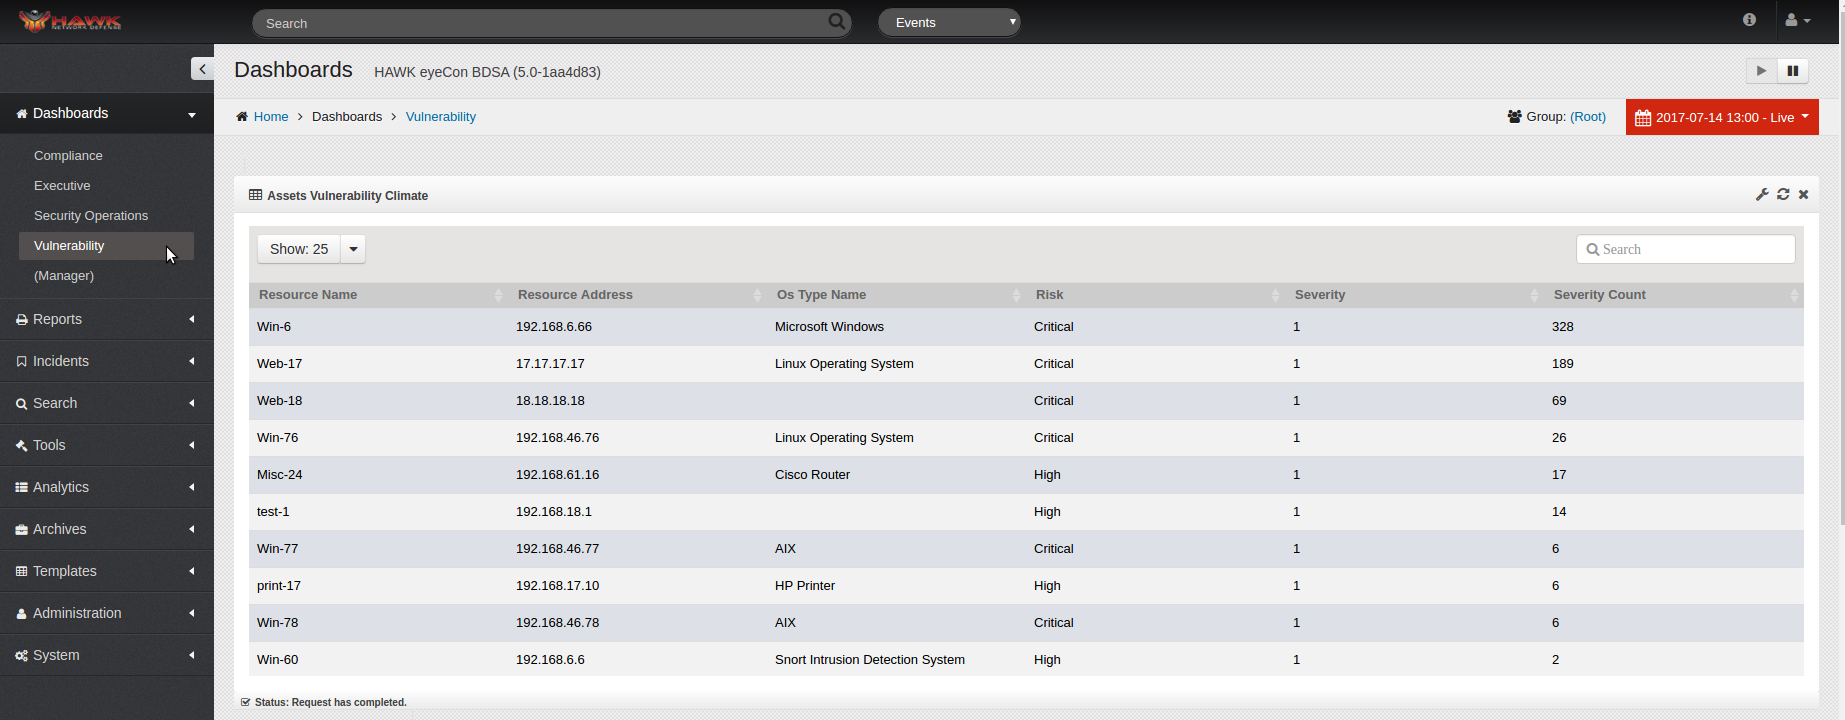
When the Vulnerability Dashboard loads, it contains the following widgets:
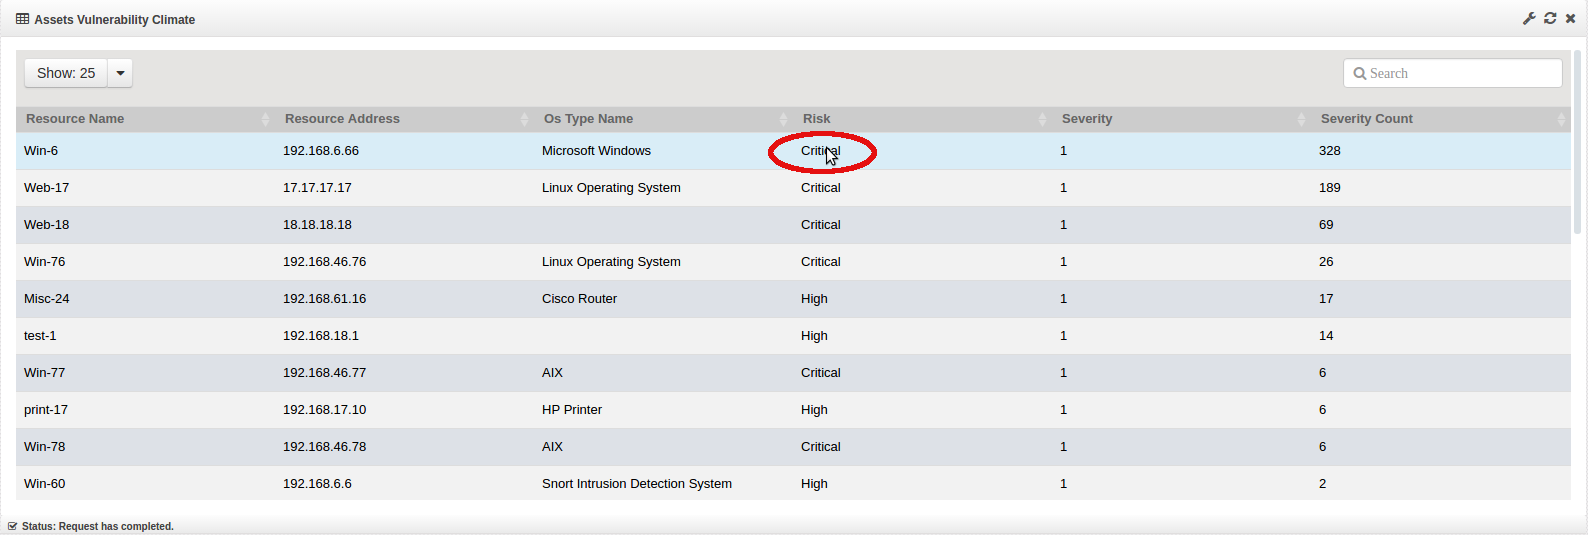
Assets Vulnerability Climate
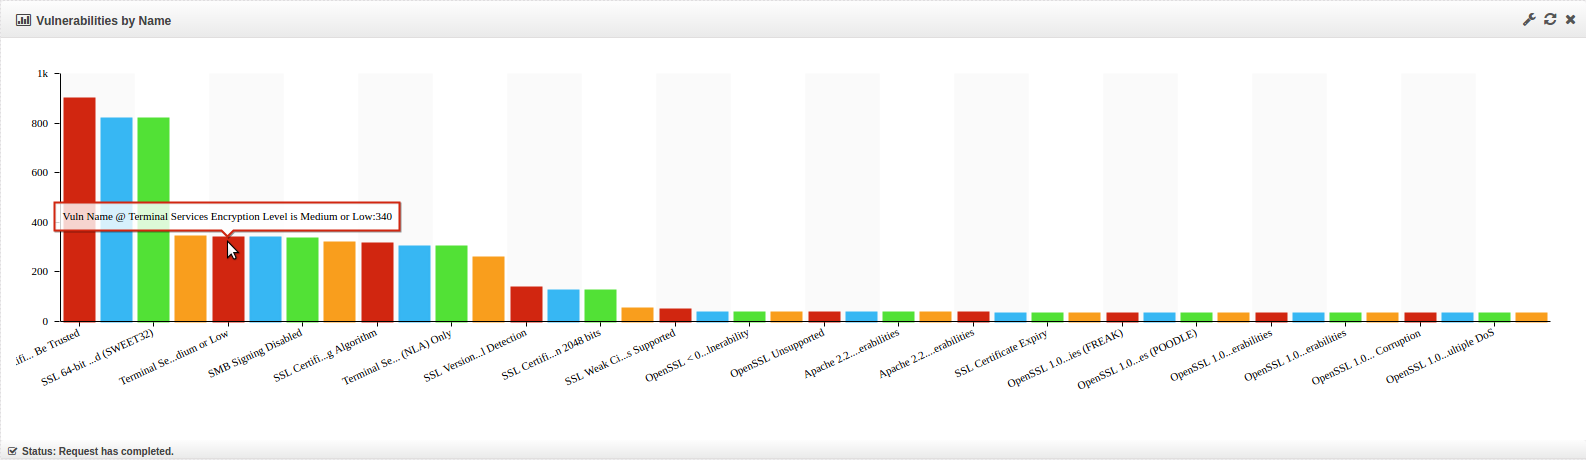
Vulnerabilities by Name
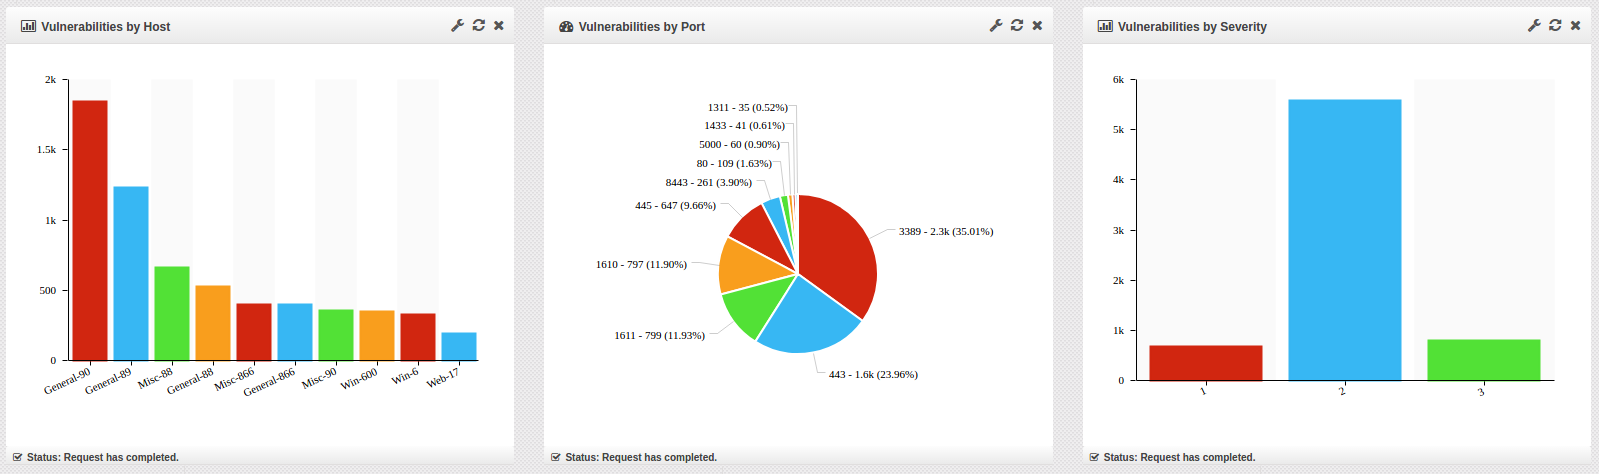
Vulnerabilities by Host
Vulnerabilities by Port
Vulnerabilities by Severity
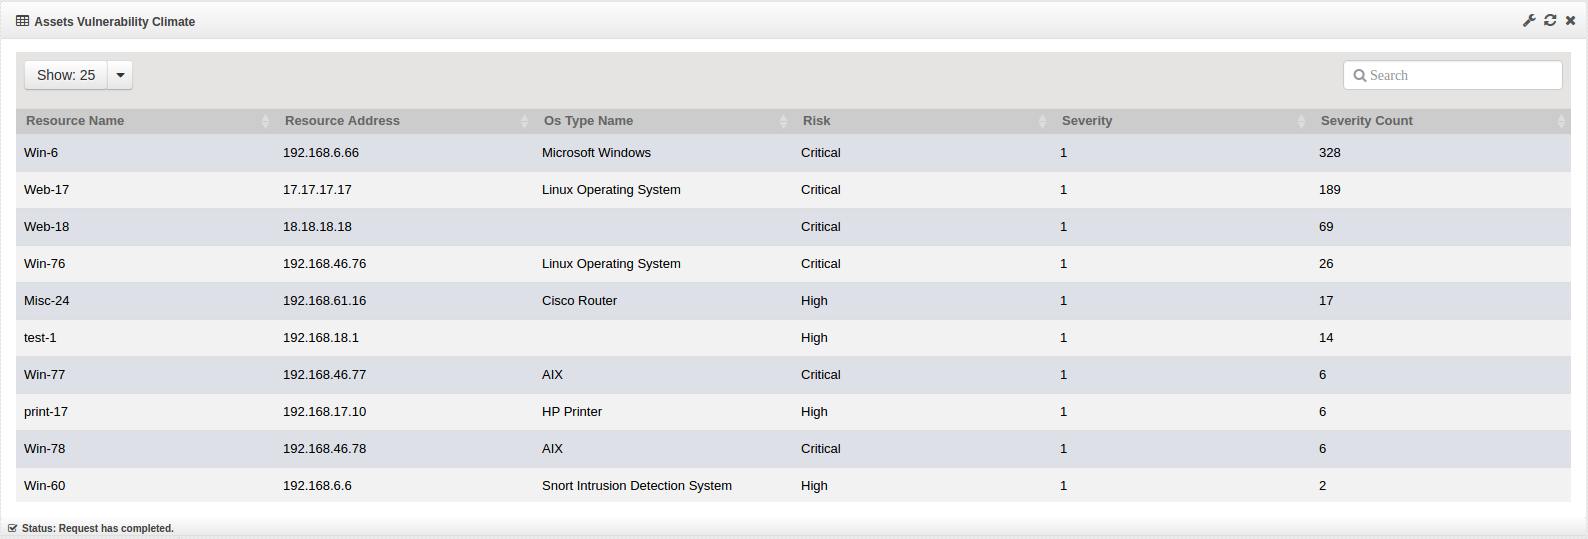
Select an element to drill down on. In this example we are drilling down on ‘Critical’. All widgets will be updated to only show Critical vulnerability data.
Select another element to drill down on. You can choose to drill down by any element (Operating System type (e.g. Windows, Linux, Router), by a specific host, Severity, etc).
In this example, we are drilling down by a specific host ‘192.168.6.66’
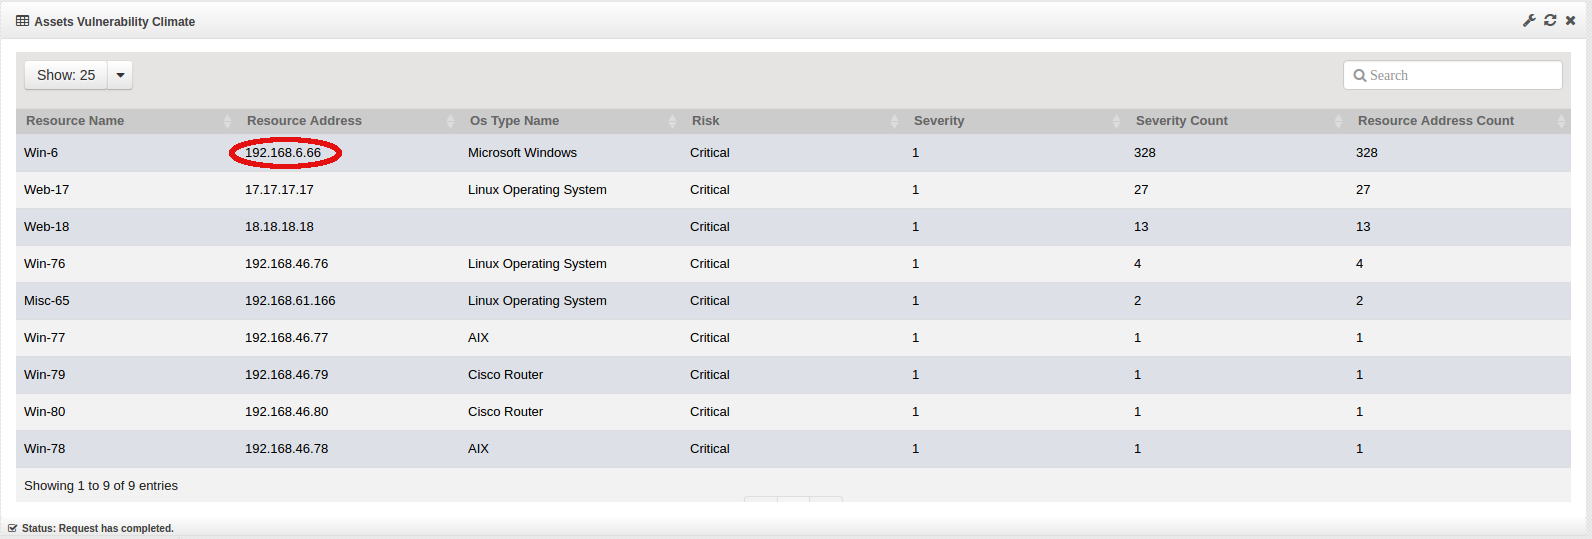
This will open the Vulnerabilities window which will provide details of the vulnerabilities.
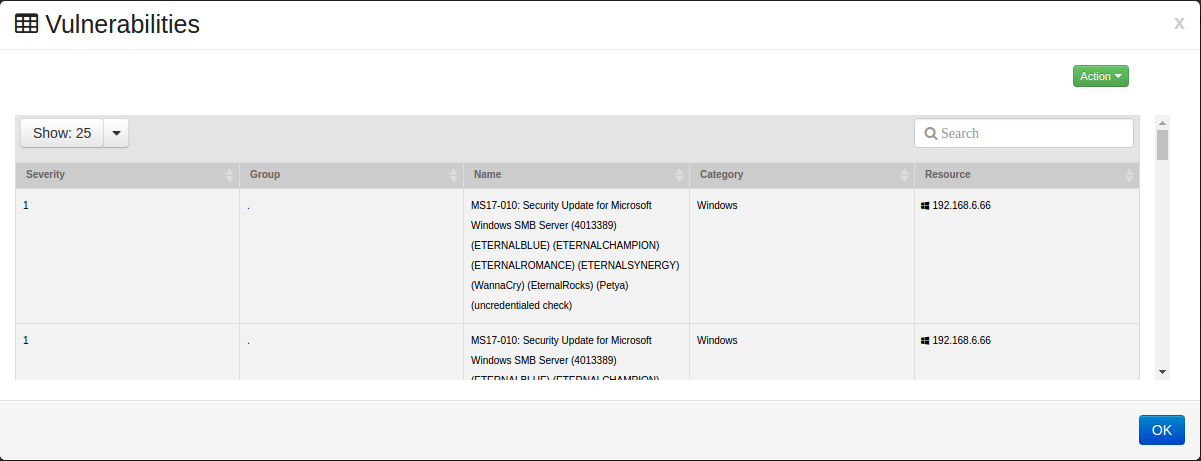
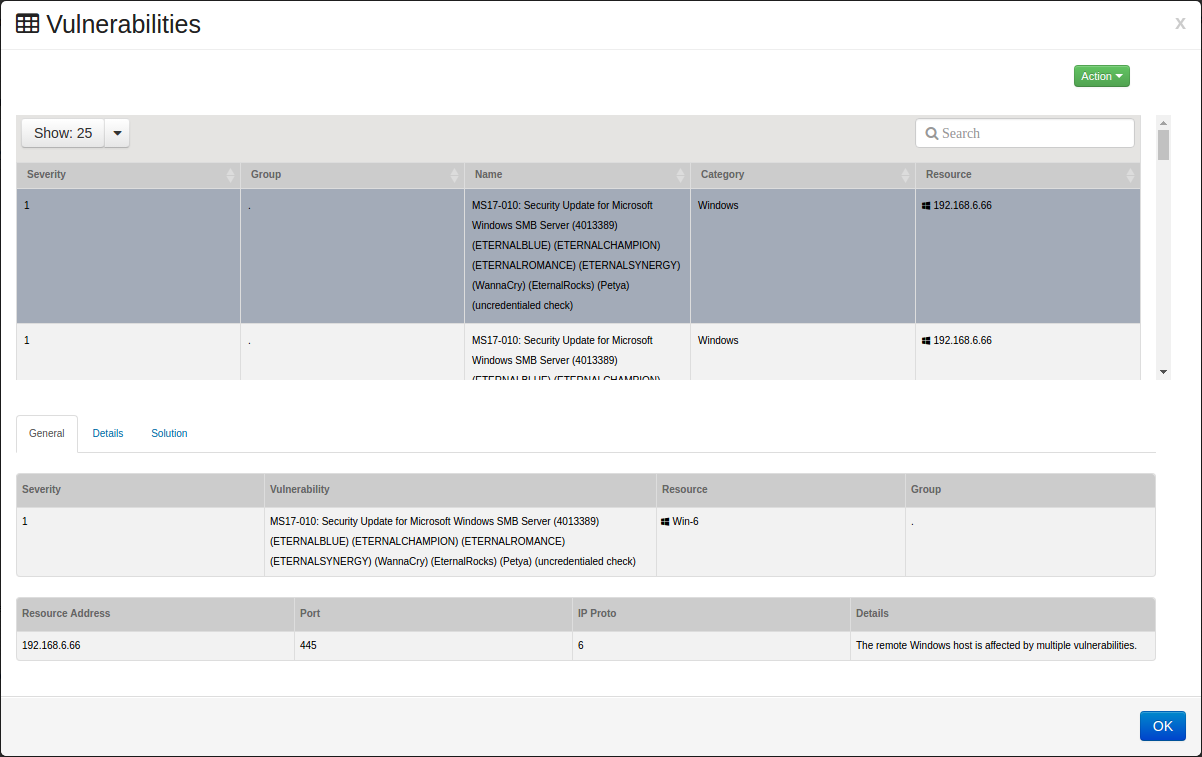
Select a vulnerability to see additional information, it will open up to the tab.
The tab will show the following information:
Severity
Vulnerability Name
Resource
Group
Resource Address
Port
IP Protocol
Details
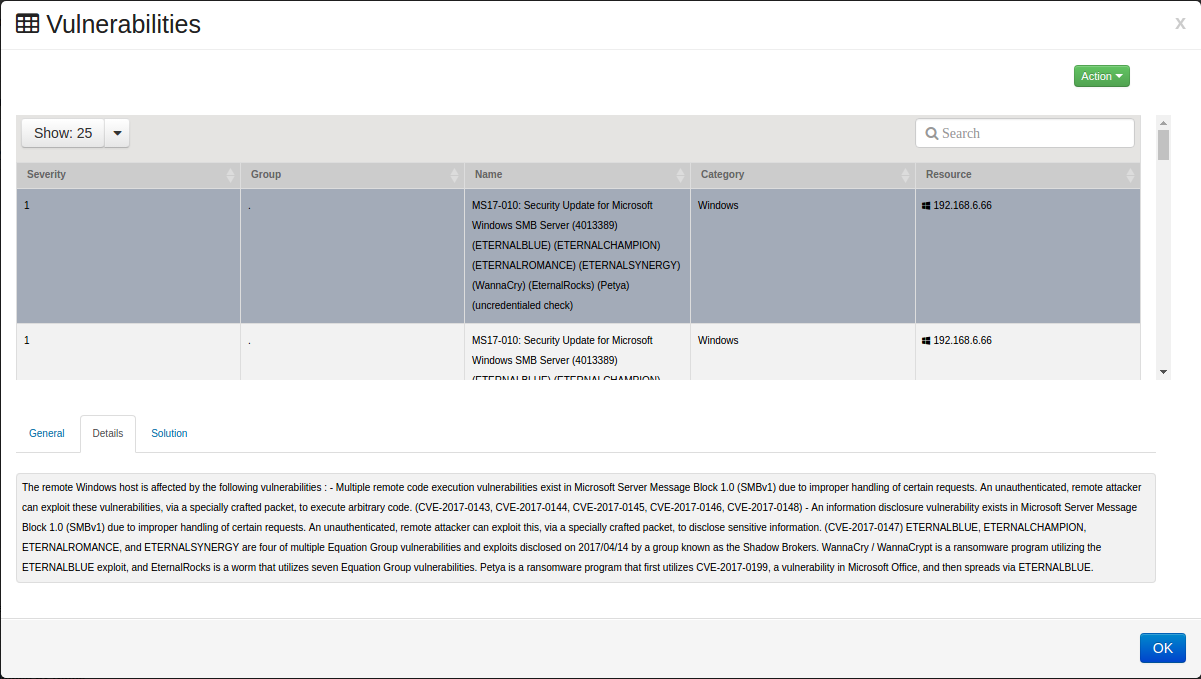
Select the tab. The Details tab will provide additional information regarding the vulnerability. It may include CVE numbers and URL’s that can be researched to better understand the vulnerability.
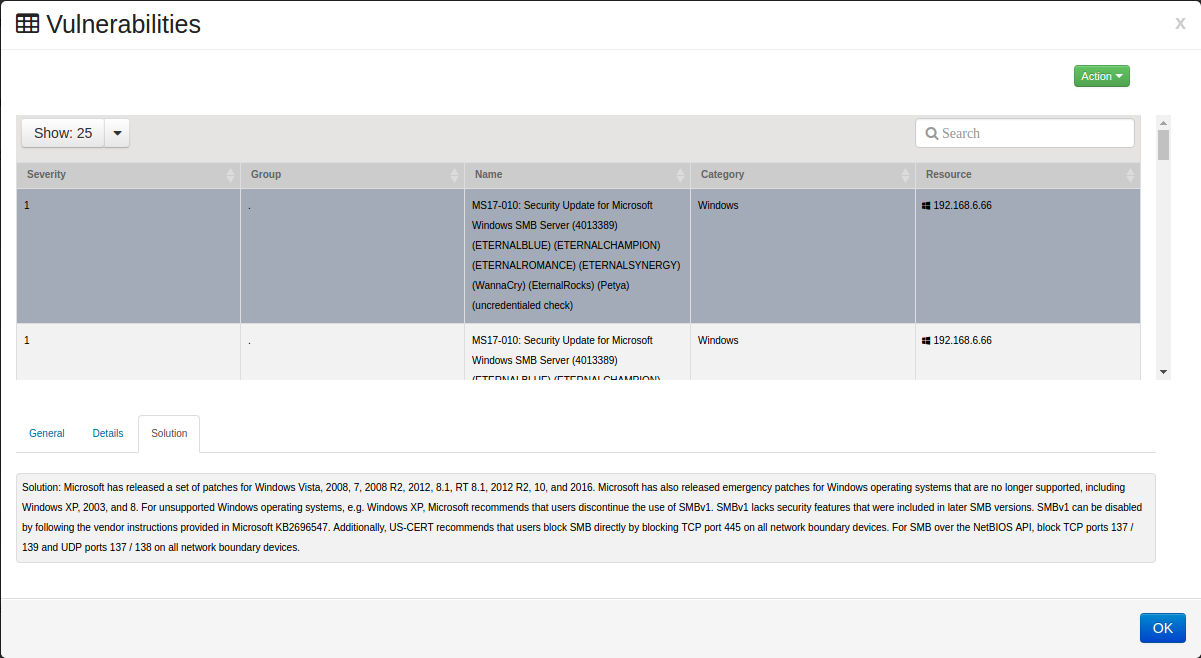
Select the tab. The Solutions tab will provide the recommended actions to take to resolve the detected vulnerability.
7.2. Working with the Dashboards
Each Dashboard contains Widgets that depict a variety of information such as events, vulnerabilities, alerts, and much more. The information is shown for a selected Group, and for a specific timeframe. This section describes how the user can select specific Groups or timeframes.
7.2.1. Selecting the Dashboard
Since a variety of Dashboards can be defined, users can select the desired Dashboard to be displayed by following these steps:
To select a different Dashboard, click on drop down menu.
Click on the desired Dashboard.
The selected Dashboard displays.
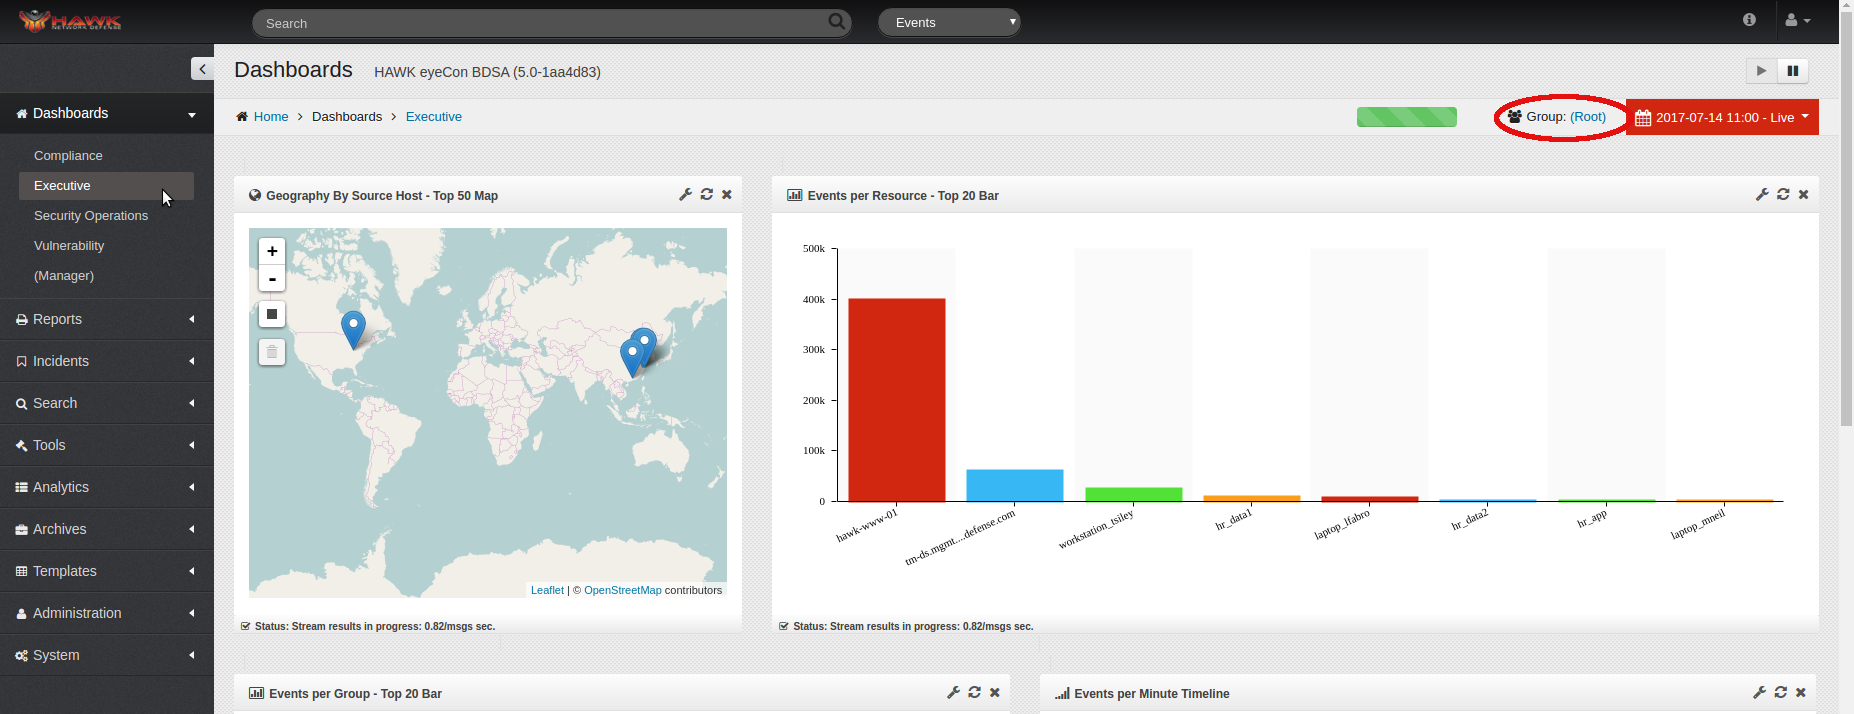
7.2.2. Selecting the Group for the Dashboard
The default group for the Dashboard is the root group; however, since there are many groups associated with the Dashboards, moving to another group is a very easy process, as shown below:
Locate the Group link on the Dashboard toward the upper right.
Click on the link for the current Group, in this example it is “(root)”.
The “Select Group” window opens.

Click on the desired Group.
Click on the button.
The Dashboard Group now displays the selected group in the main Dashboard window, and the Widgets are updated accordingly.
7.2.3. Selecting a Standard Timeframe.
There are a variety of timeframes that the analysts can select for populating the data in the Widgets. The following steps identifies the timeframes available and shows how to select the desired timeframe.
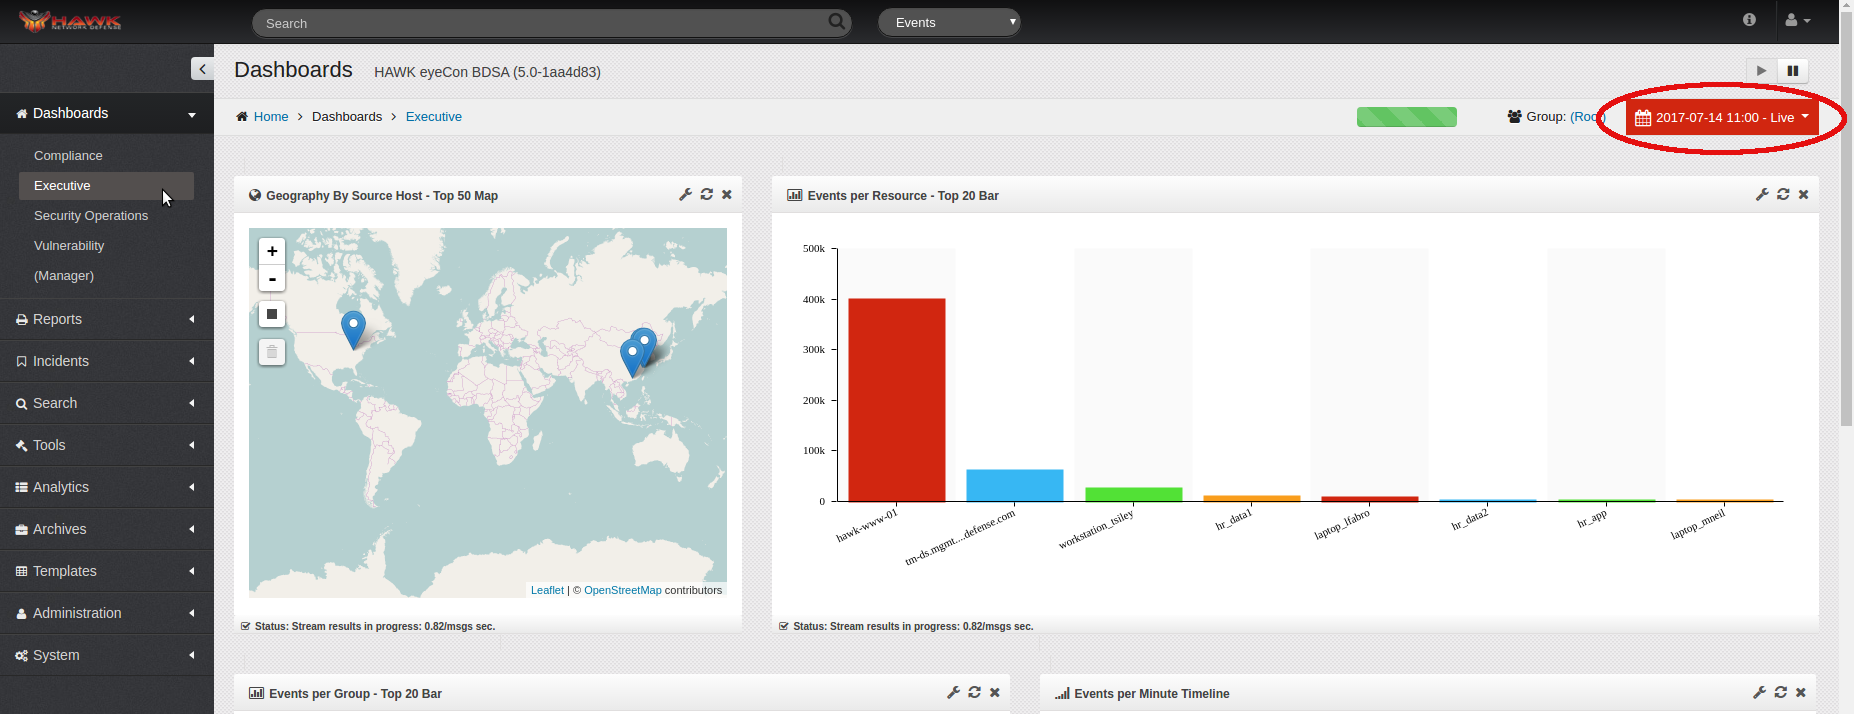
Select the desired Dashboard.
The upper right of the Dashboard has a selection of timeframes from which to choose.

Click on the drop-down menu of the timeframes to select the specific time to monitor.
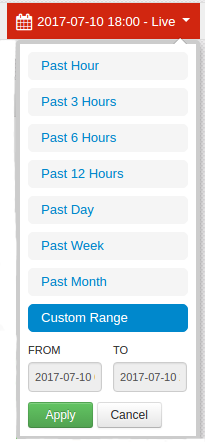
The options are:
Past Hour
Past 3 Hours
Past 6 Hours
Past 12 Hours
Past Day
Past Week
Past Month
Custom Range
To select a desired timeframe, click on the time.
Click on the button and the Widgets on the Dashboard are updated according to the selected timeframe.
7.2.4. Selecting a Custom Timeframe
There is also an option to define a custom timeframe for the Widgets on the Dashboard. The following steps show how to define a custom timeframe:
On the navigation panel, click on the desired dashboard, as shown:
Click on the drop-down menu for the timeframes on the Dashboard.
Select .
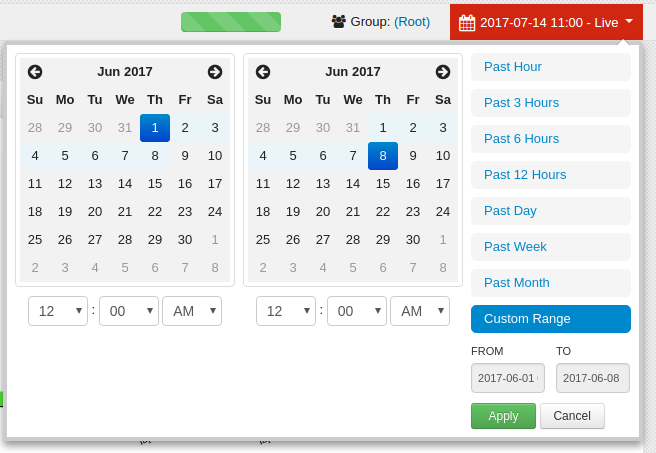
The calendar opens to allow the date to be selected by clicking on the desired start and ending dates.
Click on the drop-down menu for hour and minute to select the desired timeframe.
Click on the drop-down and select AM or PM.
Click on the button to populate the Widgets.
Note
If the ending date is grayed out, This is because the time is set into the future. Verify the time is in the past and the current day will become selectable.
7.2.5. Pausing the Dashboard
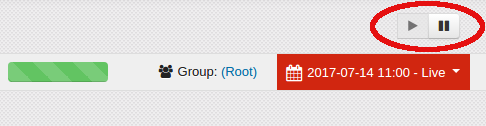
There are occasions when an analyst is working on a Dashboard that they need to pause it because they are working on a current data shard and do not want further data added.
At the top right of the Dashboard next to the group name is a “Pause” button. Click on the “Pause” icon to pause the dashboard.
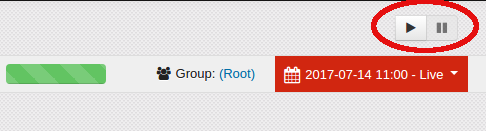
7.2.6. Starting the Dashboard
If the Dashboard has been paused it can be restarted by clicking on the “Play” button.
The “Play” button is located to the left of the Group link at the top right of the Dashboard. Click on the “Play” icon to resume updating data on the Dashboard.
7.2.7. Viewing the Event Payload
Additional information about the elements in the Dashboard can be found by drilling down into the event. This section provides the steps for drilling down into the Event Payload data.
To view the Event Payload, click on the desired Dashboard.
2. Select one of the elements to drill down on, and click on the element. The element you click on will become a filter and apply this filter to all widgets on the dashboard. In this example, we have drilled down on ‘Suspicious Activity’. Now all widgets show events in the ‘Suspicious Activity’ Category.
3. Select another element to drill down on, and click on that element. The element you click on will become another filter and open the Payload screen. In this example, we have drilled down on IP Destination ‘10.0.149.140’
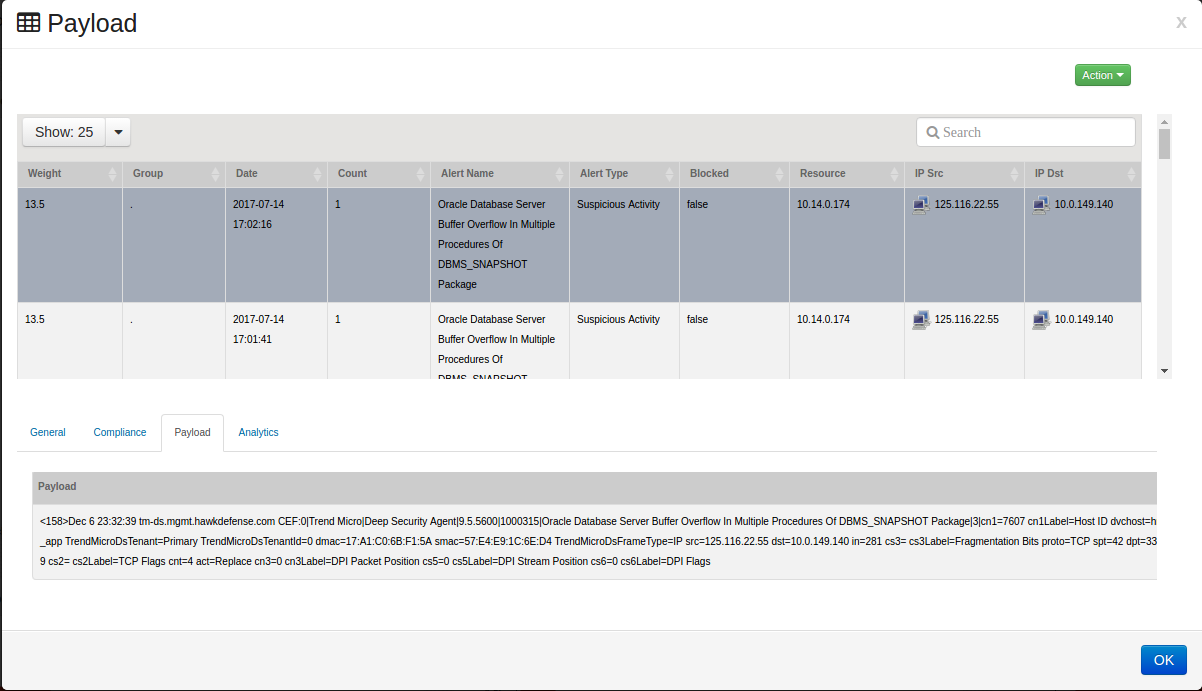
The Event Payload window displays showing all activities your selection. In this example, its showing all ‘Suspicious Activity’ from Destination Host ‘10.0.149.140’
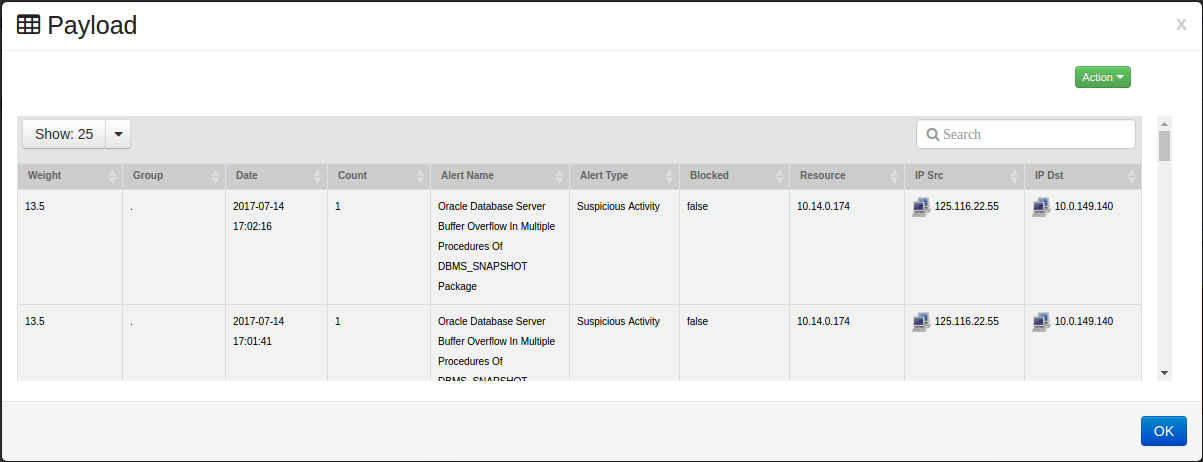
This window shows the following attributes for each event:
Weight
Group
Date
Count
Alert Name
Alert Type
Blocked
Resource IP
IP Address of the Source
IP Address of the Destination
Click on one of the events, the lower portion of the window opens to show additional details about the event:
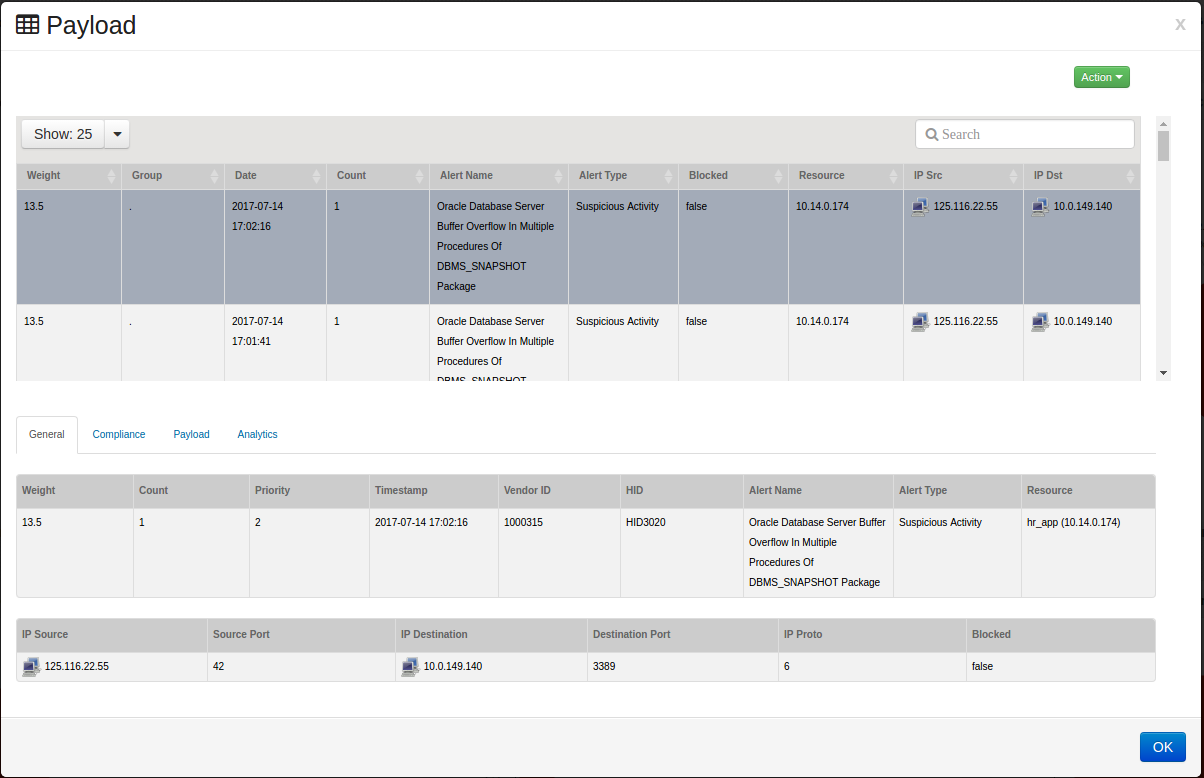
The tab shows the following attributes about the selected event:
Weight
Count
Priority
Timestamp
Vendor ID
HID (HAWK ID)
Alert Name
Alert Type
Resource
IP Address of the Source
Source Port
IP Address of the Destination
Destination Port
IP Proto
Blocked
Click on the tab:
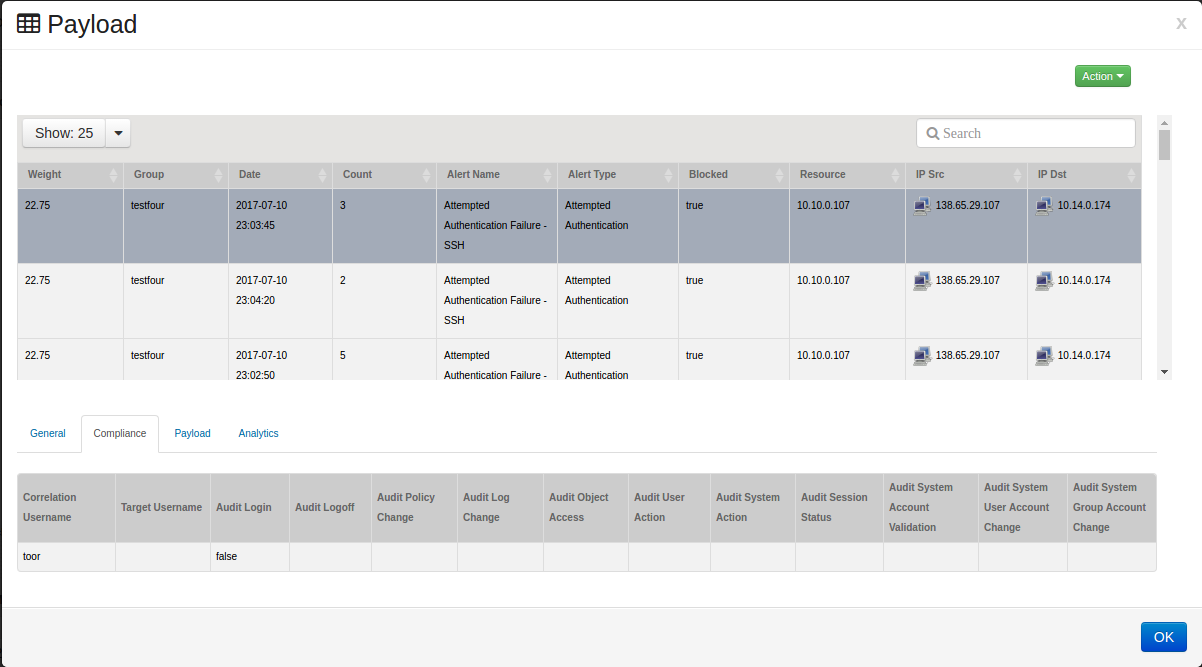
Note
If there is any Compliance information found regarding this event, it is displayed in the lower portion of the window.
Clicking on the tab shows the raw event, which includes additional details regarding the event.
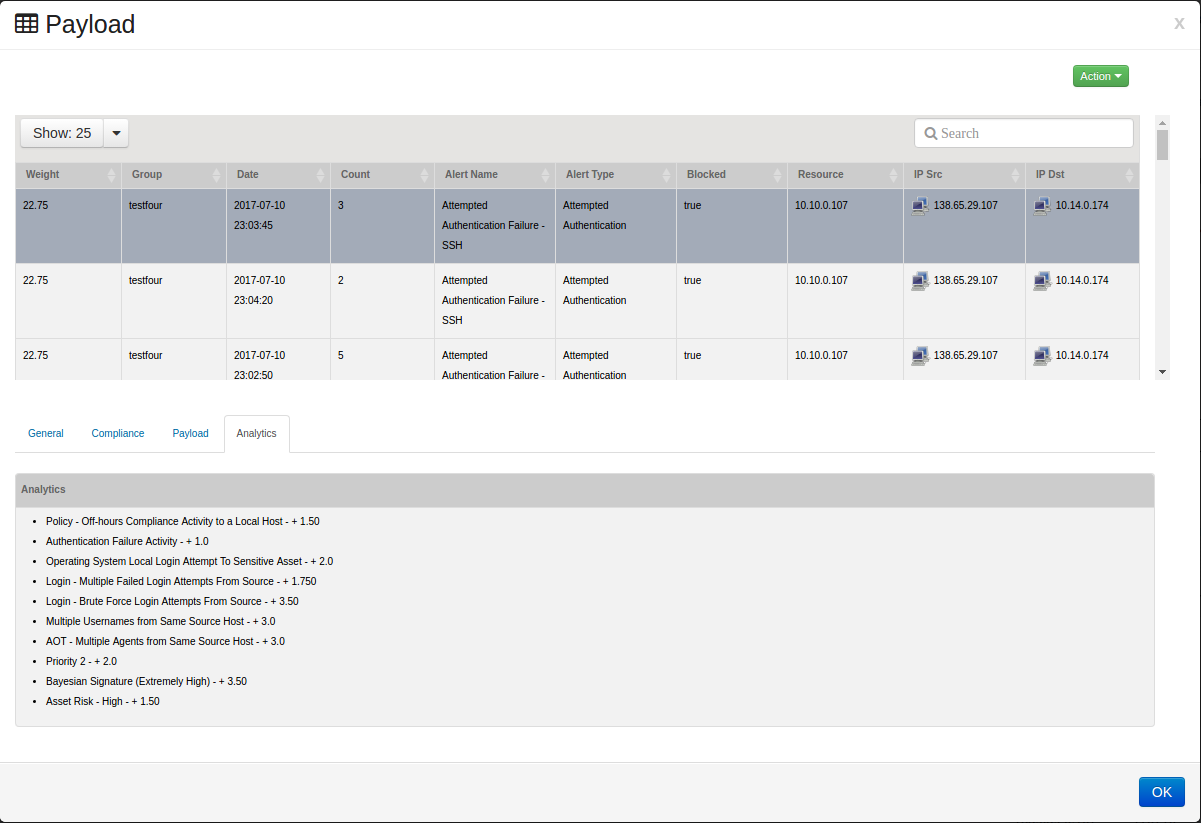
Clicking on the tab shows the Analytics rules used to calculate the weight of the event.
7.2.8. Exporting the data from Dashboards
The data on the Dashboards can be exported in two different ways.
Warning
Exporting large amount of data can cause your browser to hang. It is recommended to only export subsets of data from a dashboard. For larger datasets the Report Manager should be used.
To Export data from the ‘Payload’ window follow these steps:
Exporting data from the ‘Payload’ window. First follow the steps in the previous section ‘Viewing the Event Payload’
In order to export the Events, click on as shown below:
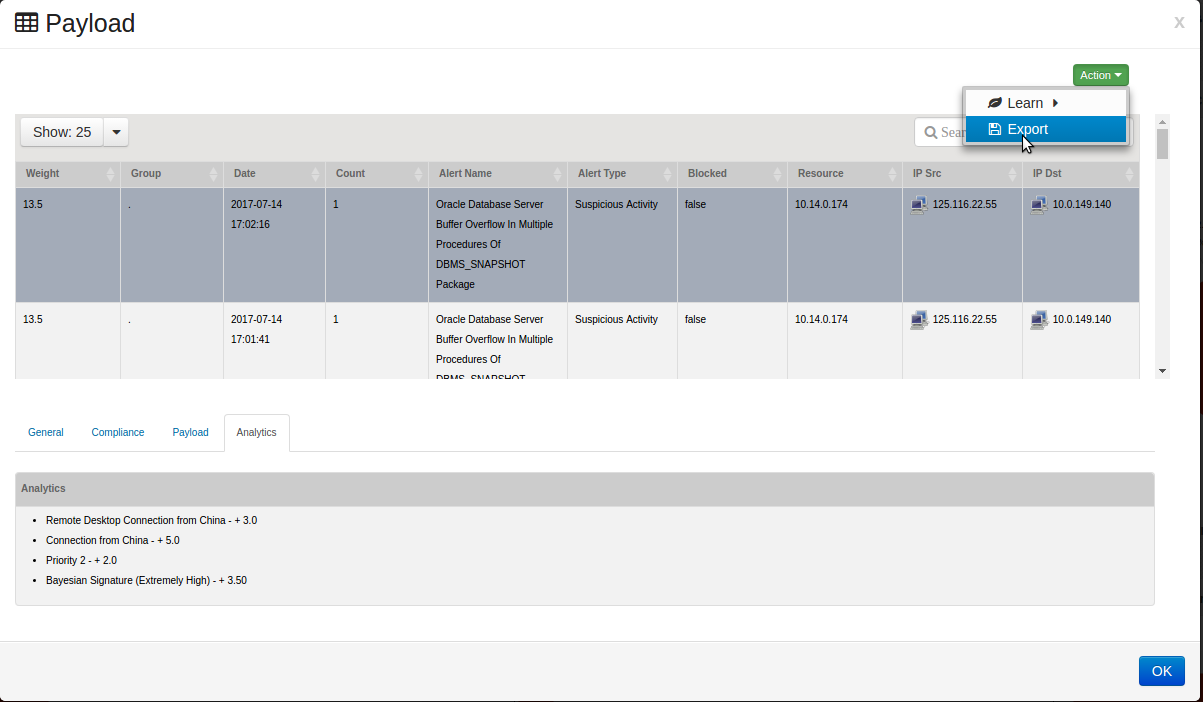
Note
All events in the payload window will be exported.
Next, select the destination for the file to export and the data is exported.
To export data from a Dashboard widget follow these steps:
At any time, you can right click on a widget and choose export.
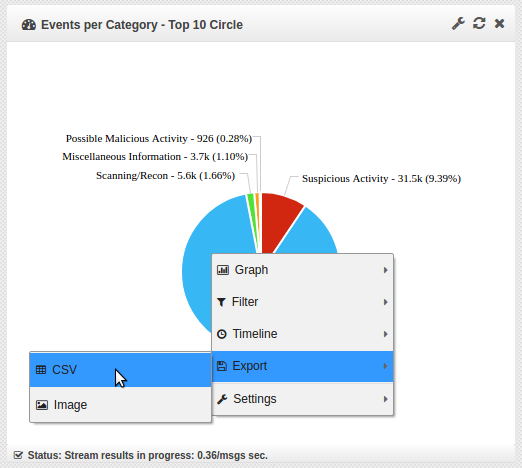
Select either CSV or Image. The selected format will be downloaded.
Note
Image will not be available on table widgets.
7.3. Managing Dashboards
Users can create a wide variety of Dashboards, which alerts the analyst to the performance of the system, specific information needed, or any other type of data that is required to ensure the integrity and health of the system.
To select an individual Dashboard, click on in the navigation panel, and select the desired dashboard and view the displays.
When the Dashboard loads, it is gathering the data that is contained in the widgets that are selected by the user to appear. There is an enormous amount of information that can be gathered and displayed in a pie chart, bar chart, or time line, such as:
Events per Category or alert status
Geography by Source Host
Events per minute
IDS Alerts
Failed logins
User activity
Administrative activity
7.3.1. Creating a New Dashboard
Depending on the type of information needed, new Dashboards with additional data is depicted by the Widgets displayed, which can be added depending on the need of the Administrators. There is no limit to the number of Dashboards that can be defined.
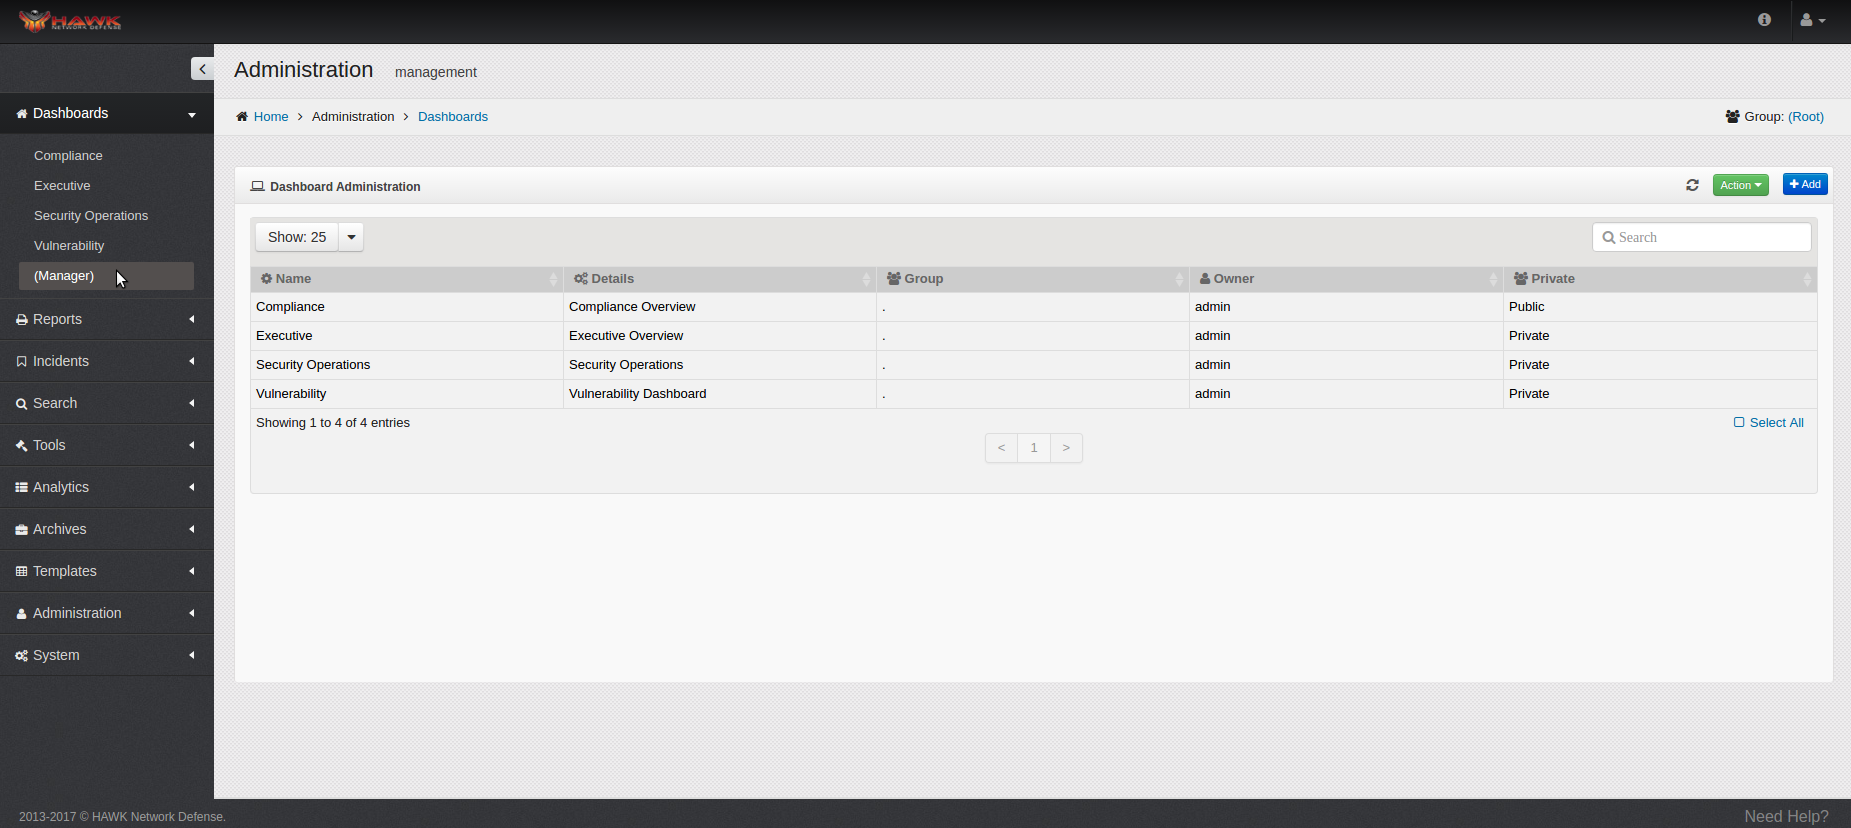
To create a new Dashboard, in the navigation panel, click on .

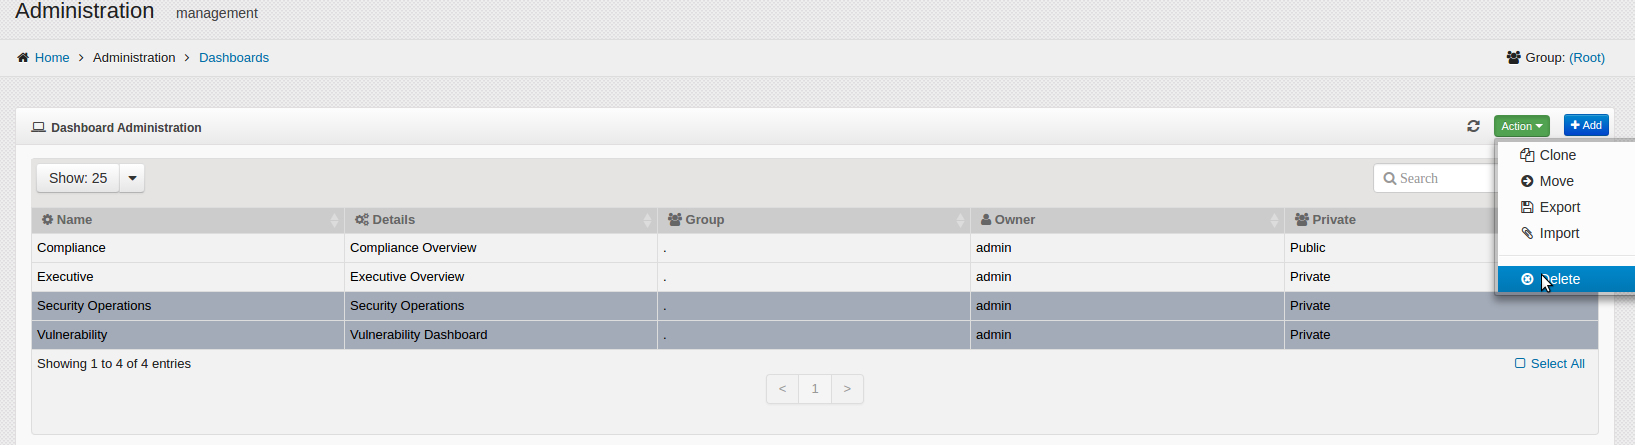
The current Dashboard Administration window opens to indicate the Dashboards which are currently defined.
For each Dashboard currently created, the following details are shown:
Name
Details
Group
Owner
Private or Public
Note
Notice in this window, the number of Dashboards shown defaults to “Show: 25” per page. This can be changed to show 10, 50, or 100 Dashboard per page, and at the bottom of the window, the number of total pages shown is identified. To change the number of Dashboards shown, click on the drop-down arrow next to “Show: 25”, and select the desired number of entries to display.
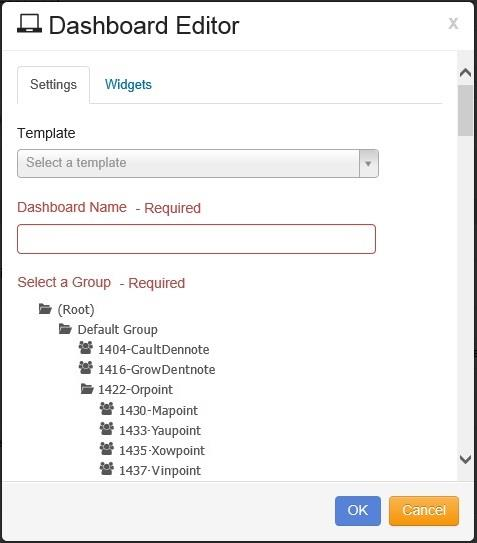
To create a new Dashboard, click on the button at the top right, and the “Dashboard Editor” window opens in the tab, as shown:
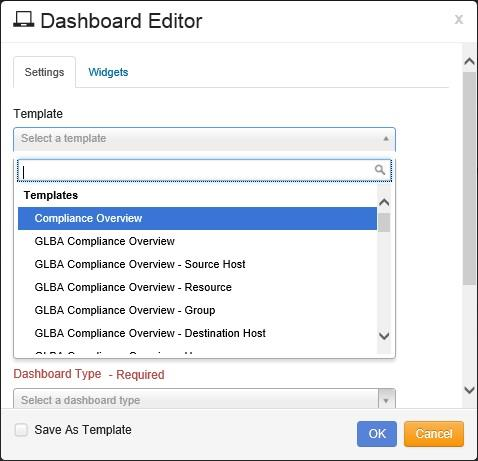
If you using a Template, Click on the drop-down arrow under Template. Scroll down to select the desired Template.
GLBA
HIPAA
PCI
SOX
Numerous others
Note
There are new Templates being defined and added; expect the list to change. Currently the different types of Templates include:
The next step is to give the Dashboard a name by entering the name in the Dashboard Name field. This is the name that appears in the Dashboards menu on the Navigation panel.
It’s recommended to be as descriptive as possible when naming the Dashboard.
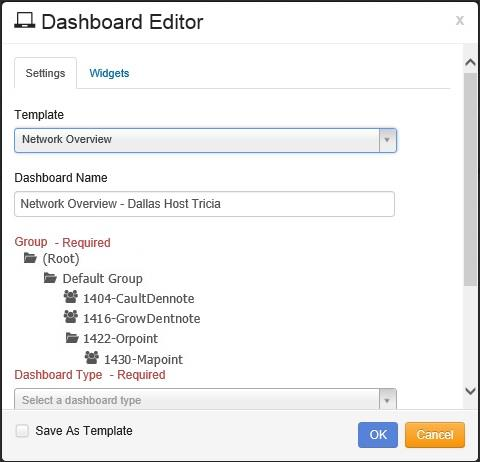
The next step is to identify the Group that this Dashboard represents.
Scroll down the list of Groups to find the specific Group and click on it to select it.

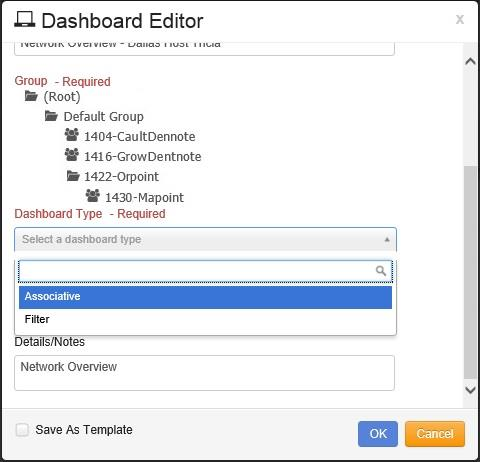
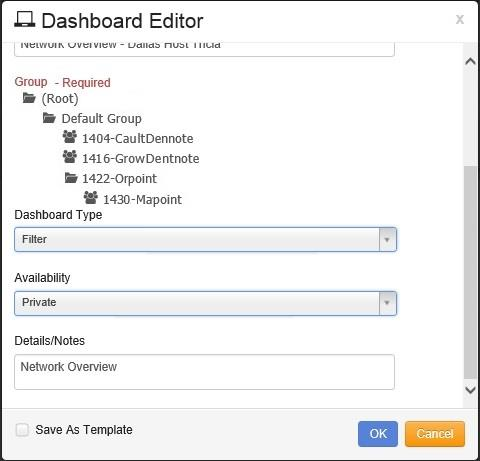
Once the Group is identified, the Dashboard Type is selected.
Click on the drop-down arrow and select:
Associative - All widgets on the Dashboard use the same item selected as a filter for the results.
Filter - The user can drill down on a individual Widget using the items selected as a filter.
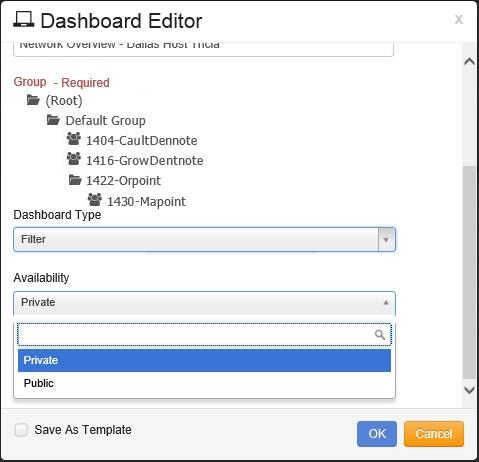
The next step is to determine if this Dashboard is to be public for all other users that have the same permissions, or if it’s private for only the user who is creating the Dashboard, by selecting the setting in the Availability field.
Under Availability, select:
Private - Only the user who created the Dashboard.
Public - All users with the same permissions.
The next step is to add the Details/Notes that is helpful to other analysts in identifying the purpose of this Dashboard.
Once all fields are entered, click on the button to create the new Dashboard. To cancel creating the new Dashboard, click on the button.
7.3.2. Deleting a Dashboard
If a Dashboard is no longer needed it can be removed.
To delete a specific Dashboard, Click on .
To delete a Dashboard or Dashboards, Click on the Dashboard or Dashboards to remove.
Click on the button.
The verification dialog opens to validate that the selected Dashboard is to be deleted.
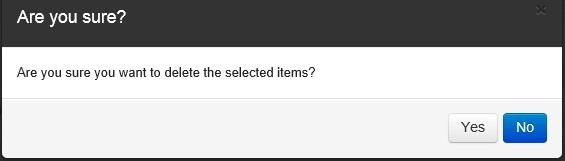
Click on the “Yes” button to delete the selected Dashboard.
Click on the “No” button to cancel the removing the Dashboard.
7.3.3. Exporting Dashboards
Dashboards can be exported to share with other team members or be used as a backup before making changes. In order to export the Dashboard and Widgets, follow the following steps:
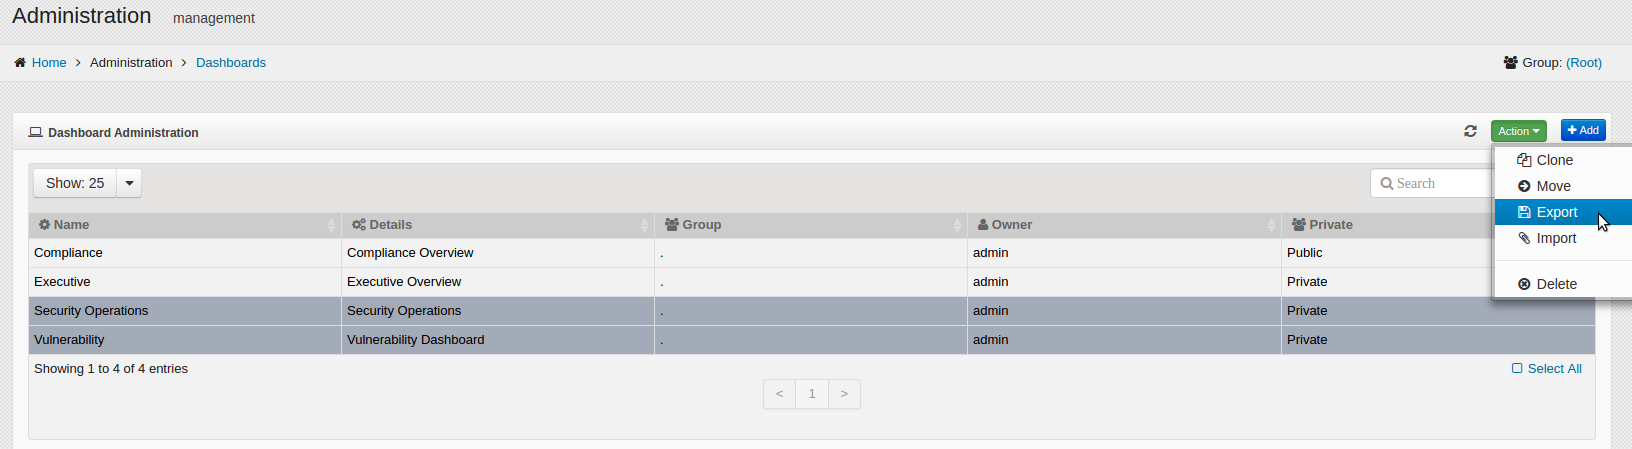
On the navigation panel, click on .
The Dashboard Administration window opens.
Select one or more items to export. If no items are selected, all items are exported.
Click on the button.
A window opens to allow the user to select the destination for the export.
Click on the destination.
Click on the “Save” button.
The date from the file is now exported.
7.3.4. Importing Dashboards
This section provides the steps to import Dashboards and their widgets.
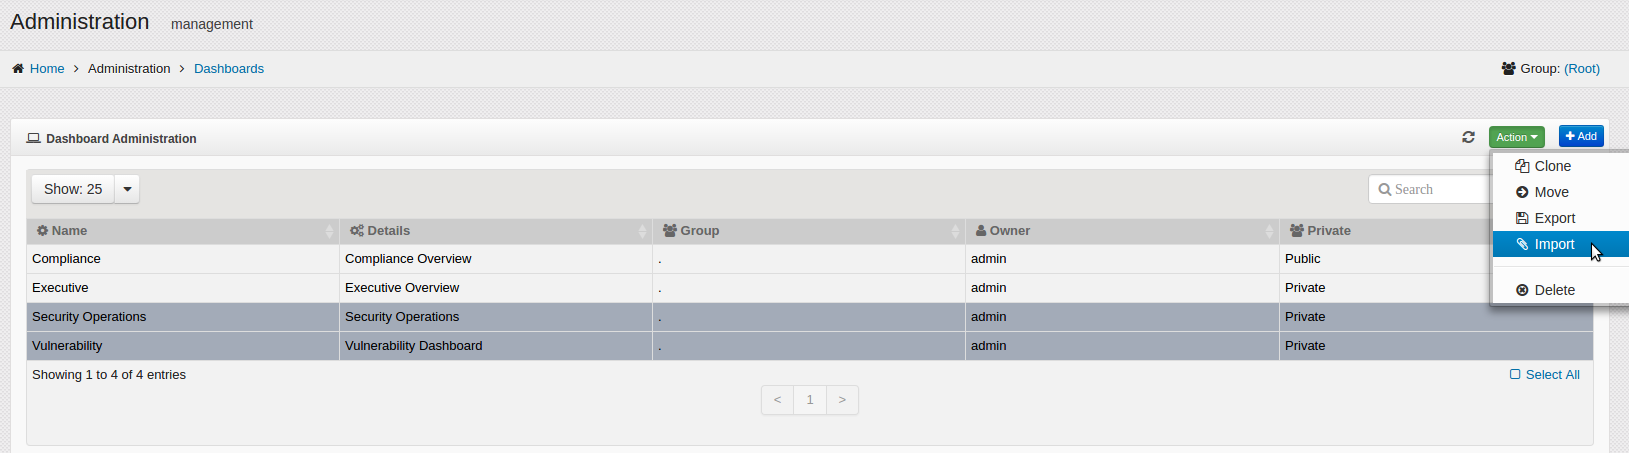
On the navigation panel, click on .

The Dashboard Administration window opens.
Click on the button.
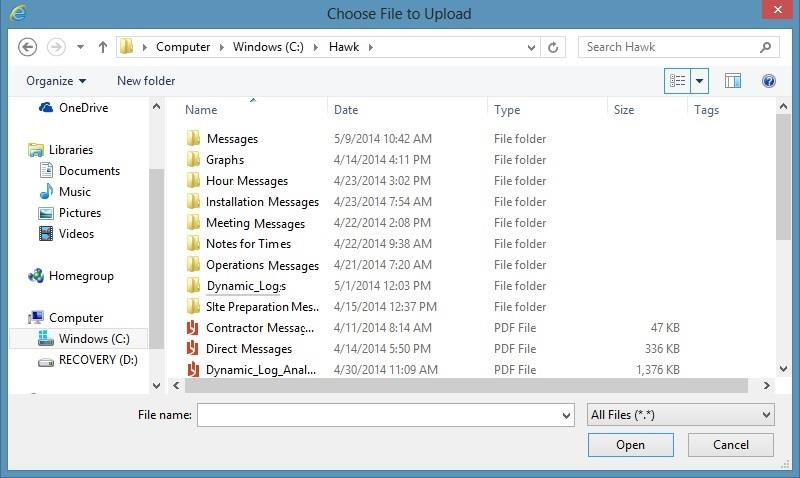
The “Choose File to Upload” window opens to navigate to the file to import.
Click on the desired file, and click on the “Open” button.
The next dialog box allows the user to determine the destination Group where the imported data is to be placed.
Click on the “Yes” button to import the data to the currently selected Group.
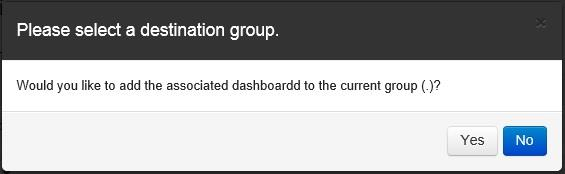
If the user wants to select a different Group where the data is to be imported, click on the “No” button, and the “Select Group” window opens.
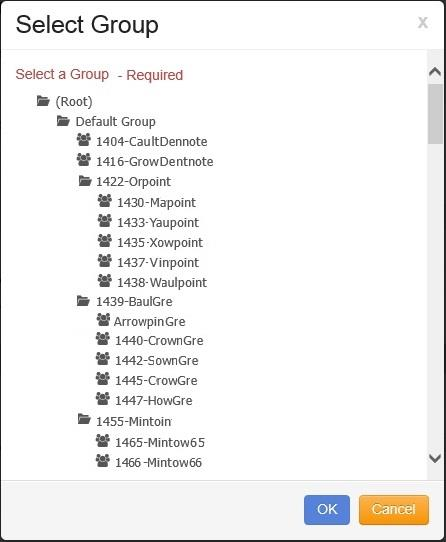
Click on the desired Group.
Click on the “OK” button.
The data is then imported into the selected Group.