9. Working with Incidents
Once the incident is identified, there are several actions that can be taken, as shown below:
9.1. Working with the Incidents Dashboard
There is a variety of activities that are performed with the Incident Dashboard. These are shown below:
9.1.1. Viewing the Incident Manager Dashboard
In order to view the Incidents Manager Dashboard, follow these steps:
On the navigation panel, click on
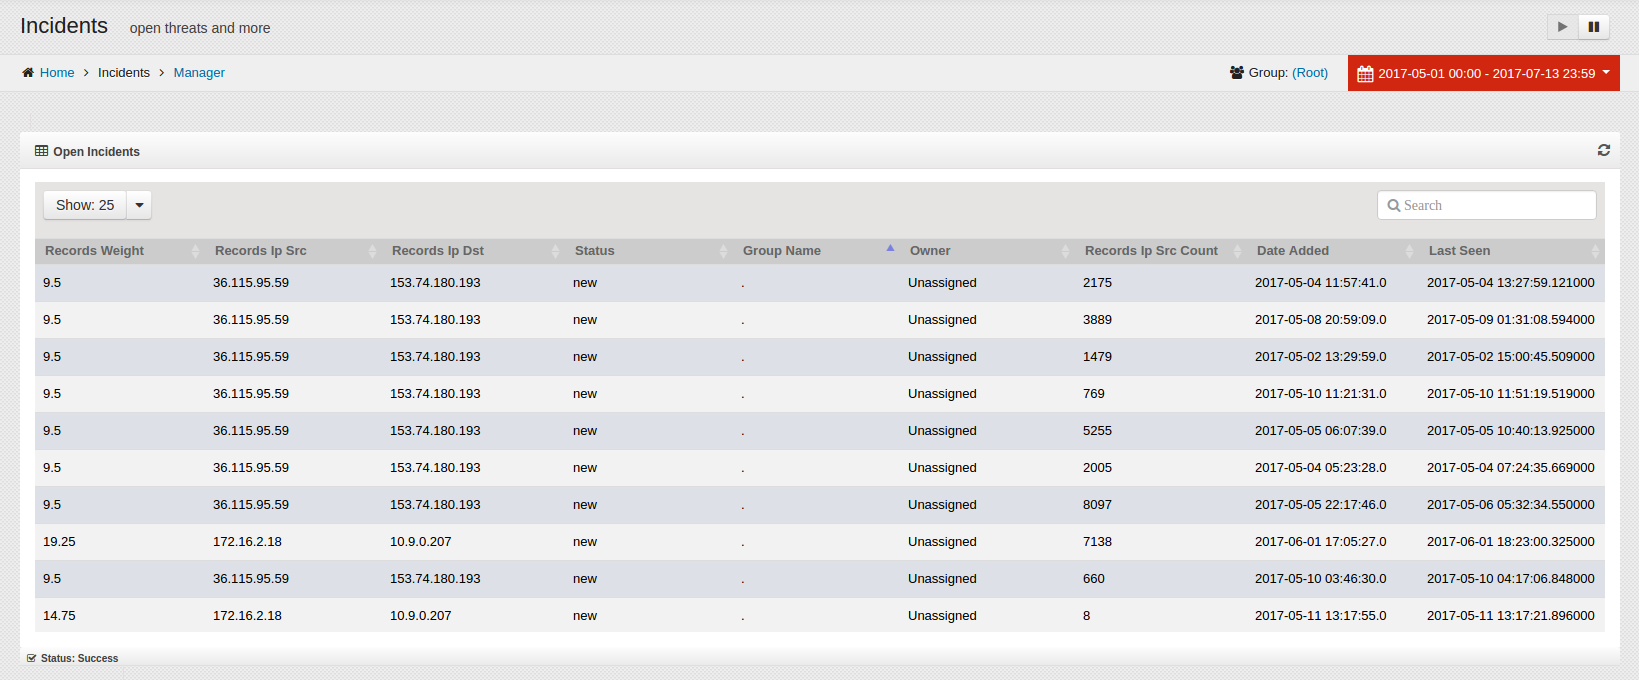
The Incidents Manager window opens:
The Incidents Manager dashboard contains a prioritized list of open Incidents which supplies the following information:
Records Weight - Average weight assigned to events contained in the incident
Records IP Src - IP source address of events in the incident
Records IP Dst - IP destination address of an event in the incident. (Additional destination IP address can be found by opening the incident.)
Status - Current status of the Incident
Group Name - Group name the incident is created under
Owner - User assigned to incident
Records Ip Src Count - The amount of events in the incident
Date Added - Date the incident was created
Last Seen - Last date the incident was updated with new event data
9.1.2. Viewing the Incidents Dashboard
In order to view the Incidents Operations Dashboard, follow these steps:
On the navigation panel, click on

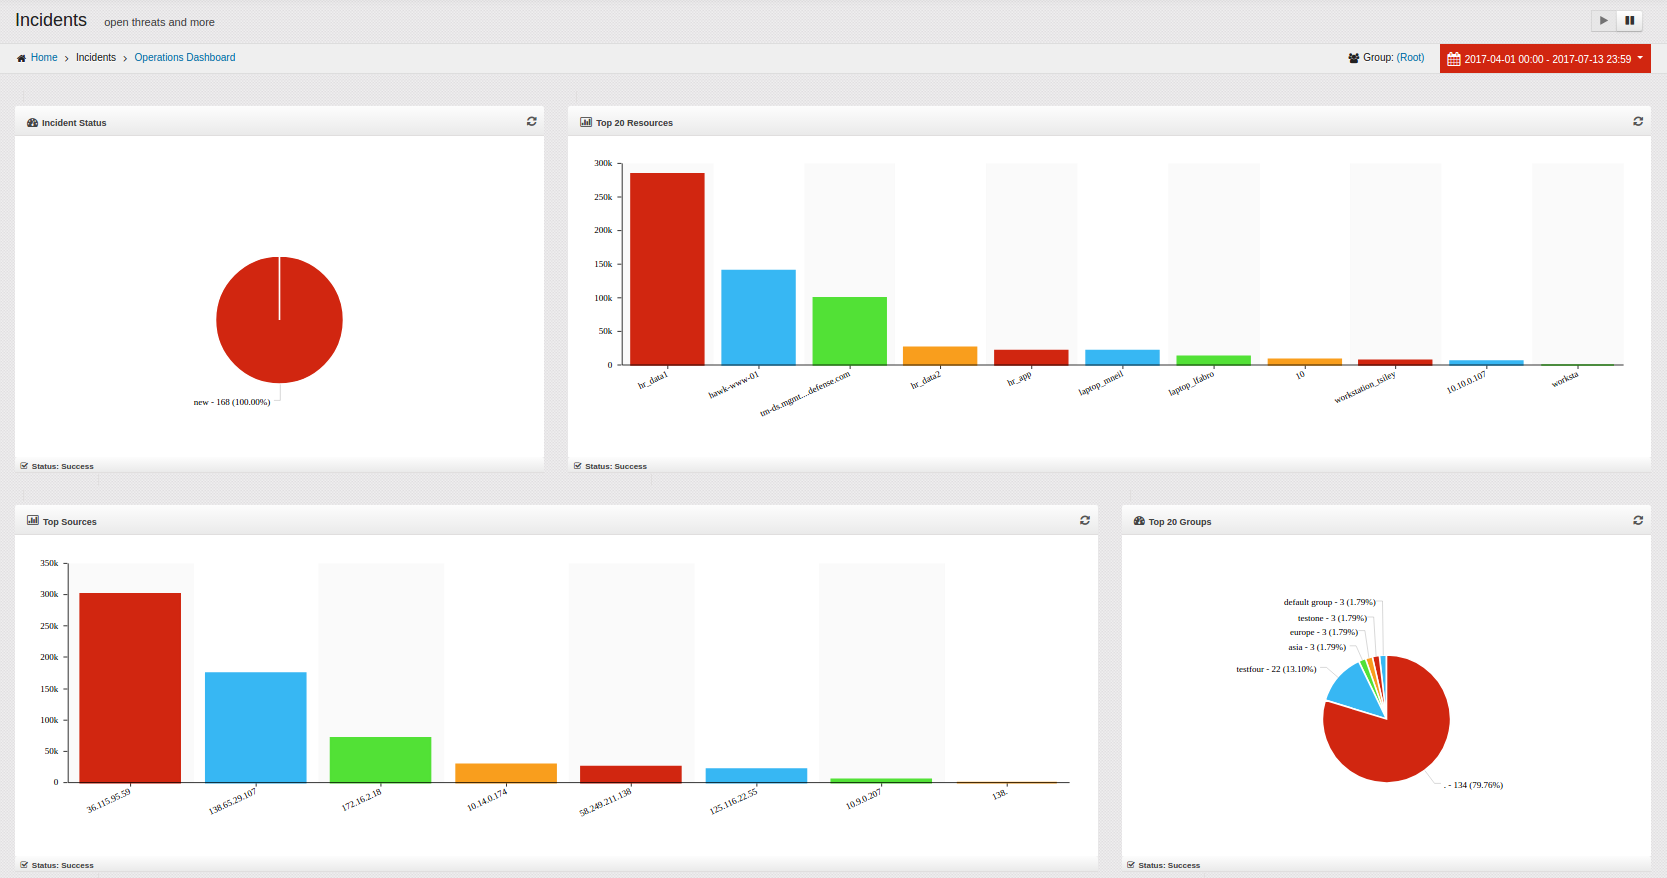
The Incidents Operations window opens:
The Incidents Dashboard contains Widgets which supply the following information:
Incident Status - Shows incidents that are New, In progress, False positives, Open, Pending.
Top 20 Resources - Shows the Resources for the top 20 Resources.
Top Sources - Shows IP addresses from the top number of originating sources.
Top 20 Groups - Displays the Top 20 Groups having the highest number of Incidents.
Top 20 Destination Ports - Shows the Top 20 Destinations having the highest number of Incidents.
Top Destinations - Shows IP addresses from the top number of destinations.
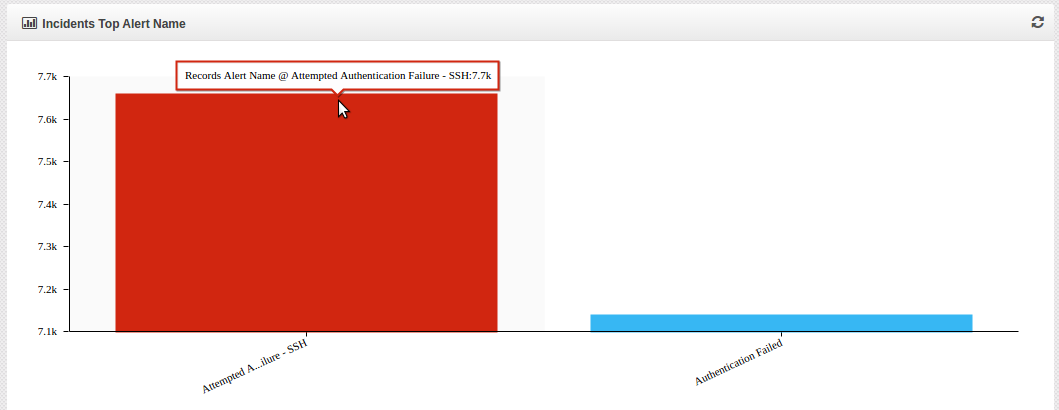
Incidents by Top Alert Name - Indicates all the top level of incidents by name.
Incidents by Top Priorities - Indicates all the Top Priorities of incidents.
- Open Incidents - Indicates the Recent 250 incidents which are opened and/or being investigated. This section shows the following information for the open Incidents:
Records Weight - Average weight assigned to events contained in the incident
Name - Incident Name with IP Source address
Status - Current status of the Incident
Owner - User assigned to incident
Records Ip Src Count - The amount of events in the incident
Date Added - Date the incident was created
Last Seen - Last date the incident was updated with new event data
9.1.3. Changing the incident Group
Since the Incidents are arranged by Groups, the analyst can select a different Group by following these steps:
On the navigation panel, click on
The Incidents Manager window opens:
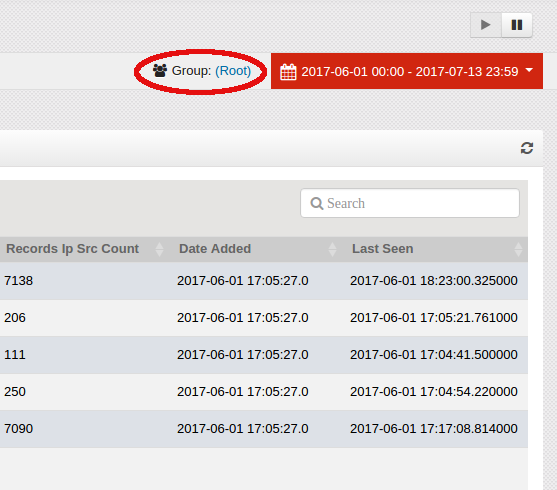
On the top right side of the Incidents Administration window, click on the link to the Group shown. In this example, the Group is “(Root)”.
The “Select Group” window opens.
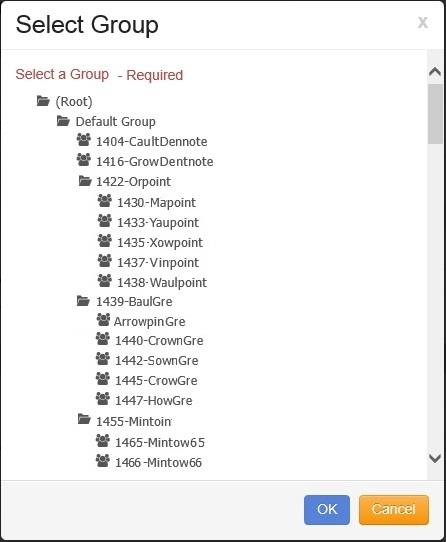
Click on the desired group.
Click on the button and the selected Group is changed on the Incident Management window. The Widgets displayed reflect the data in the selected Group.
9.1.4. Opening Incidents
In order to get additional detailed information regarding the incident, follow these steps:
On the navigation panel, click on

Click on an Incident to review the Incident in detail.
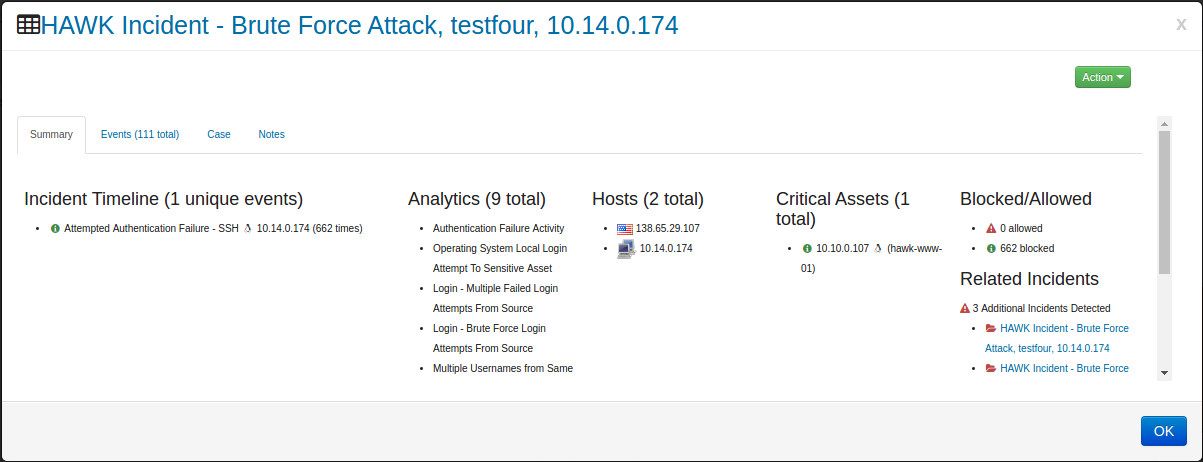
The Incident will open to the Summary Tab. The Summary Tab shows the following information:
Incident Timeline - Shows unique list of events by time
Analytics - Shows a unique list of Analytics rules that were applied to this incident
Hosts - List of unique host involved in the incident
Critical Assets - List of unique critical assets involved in the incident
Blocked/Allowed - Shows how man blocked and allowed events in the incident
Related Incidents - A list of additional incidents that are related to the current incident
For even further information regarding the status of this event, click on tab, Then click on an individual event.

Notice in this window, there are four tabs at the bottom which provides even greater detail about the selected event. These four tabs are:
General - Shows the following information:
Weight
Count
Priority
Timestamp
Vendor ID
HID
Alert Name
Alert Type
Resource
IP Source
Source Port
IP Destination
Destination Port
IP Proto
Blocked
Additinal fileds may be present on IDS events:
IP Version
IP Header Length
IP ID
IP Offset
IP ITIL
IP Csum
Compliance - Any information regarding Compliance for this event is shown in this tab.
Correlation Username
Target Username
Audit Login
Audit Logoff
Audit Policy Change
Audit Log Change
Audit Object Access
Audit User Action
Audit System Action
Audit Session Status
Audit System Account Validation
Audit System User Account Change
Audit System Group Account Change
Payload - Shows the log that was received or shows the Hex Payload and the ASCII Payload.
Analytics - Shows the Analytic rules that was associated with this specific event as shown below:
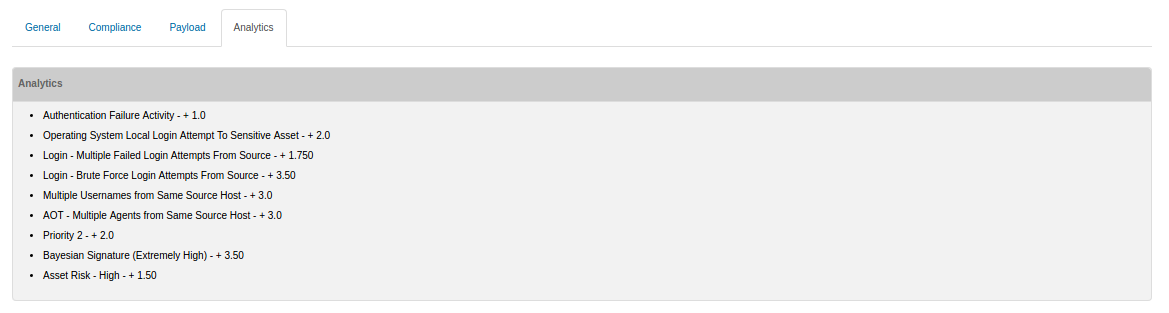
Click on Tab.
This will open the light weight case management window. Information here can help track and document working incidents and sharing information between team members.
The following information can be entered:
Case Name - A name to be assigned to the incident
Owner - The handler of the incident
Summary - A brief summary of the incident
Root Cause - Once the root cause is determined it should be entered here
Source Details - Details related to the source address
Destination Details - Details related to the destinations
Feedback - Feedback related to the incident
Feedback Comment - Details related to the feedback above
Corrective Action Plan - The Containment, Eradication, & Recovery process that will be used
Note
Click the Save button to save the changes made in the case.
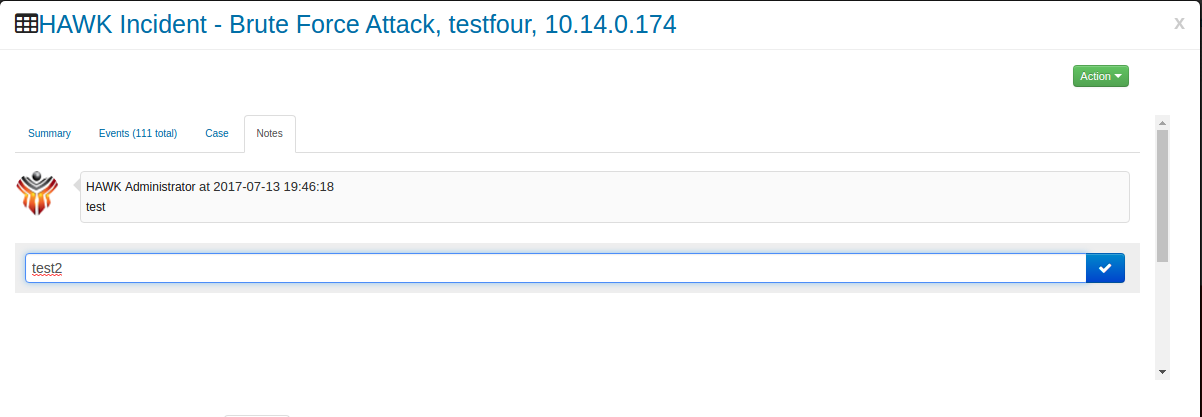
Click on Tab.
This will open notes that have been applied to the incident. Each action performed on the incident will create an automatic note including a time stamp of the action. (e.g., Changing the owner, Changing the status)
To add a new note, enter a the note and click on the blue check box or hit enter.
Click on .
This allows the user to set the status of the event. The choices are:
New
Open
In Progress
Pending
False Positives
Closed
9.1.5. Drilling Down on the Incident
In order to get additional detailed information regarding the incident, follow these steps:
On the navigation panel, click on
The Incidents Operations window opens:
Hovering over the desired items shows additional information, as shown here:
Click on the desired item to filter all widgets using the item clicked on as the filter:
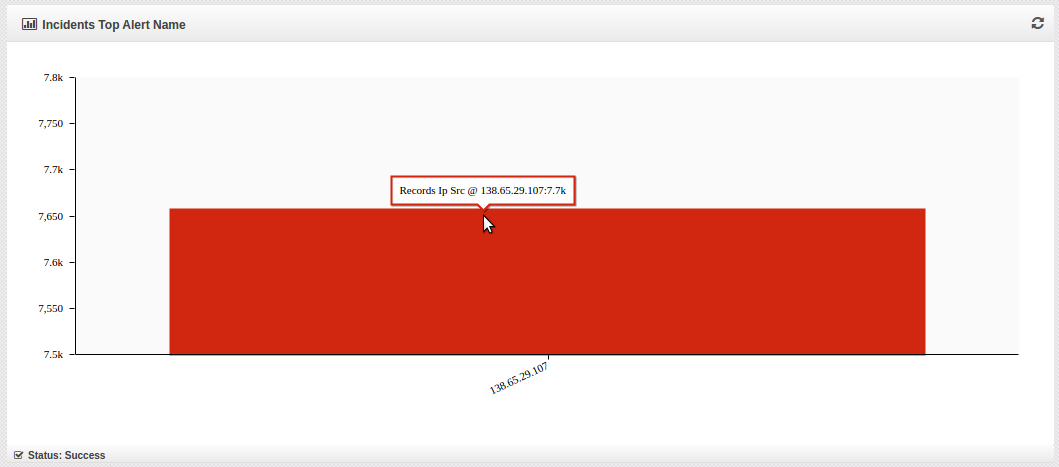
Clicking on a specific bar in the widgets to drill down even further, produces a window that shows the individual Incidents that you can choose from.
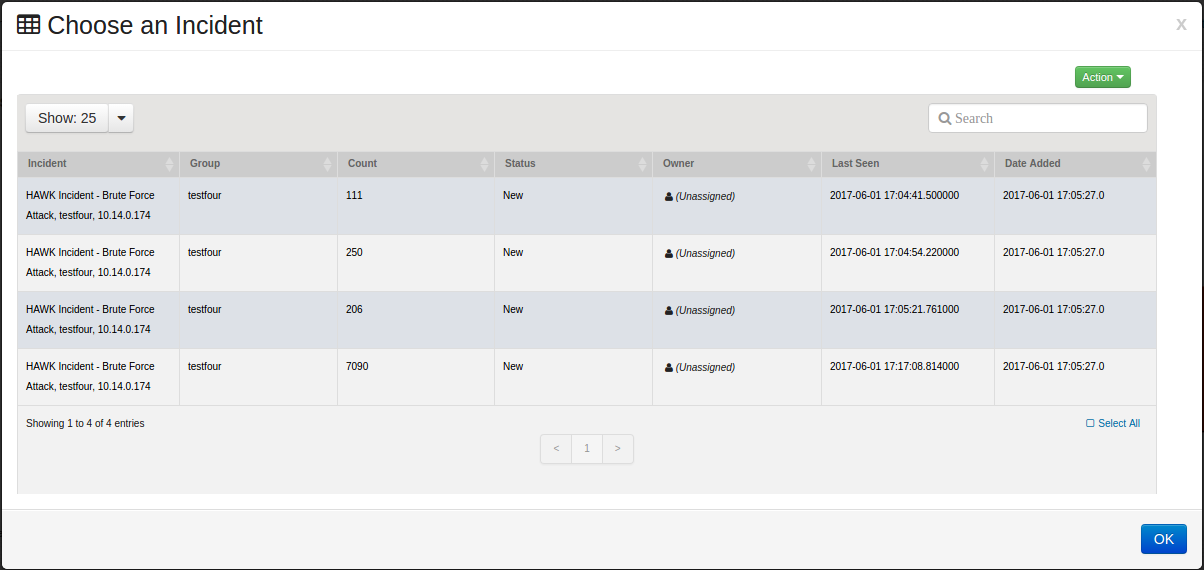
The data for this Incident can be further expanded by clicking on the Incident, and more details about the specific Incident are shown.

The Incident will open to the Summary Tab. The Summary Tab shows the following information:
Incident Timeline - Shows unique list of events by time
Analytics - Shows a unique list of Analytics rules that were applied to this incident
Hosts - List of unique host involved in the incident
Critical Assets - List of unique critical assets involved in the incident
Blocked/Allowed - Shows how man blocked and allowed events in the incident
Related Incidents - A list of additional incidents that are related to the current incident
For even further information regarding the status of this event, click on tab, Then click on an individual event.
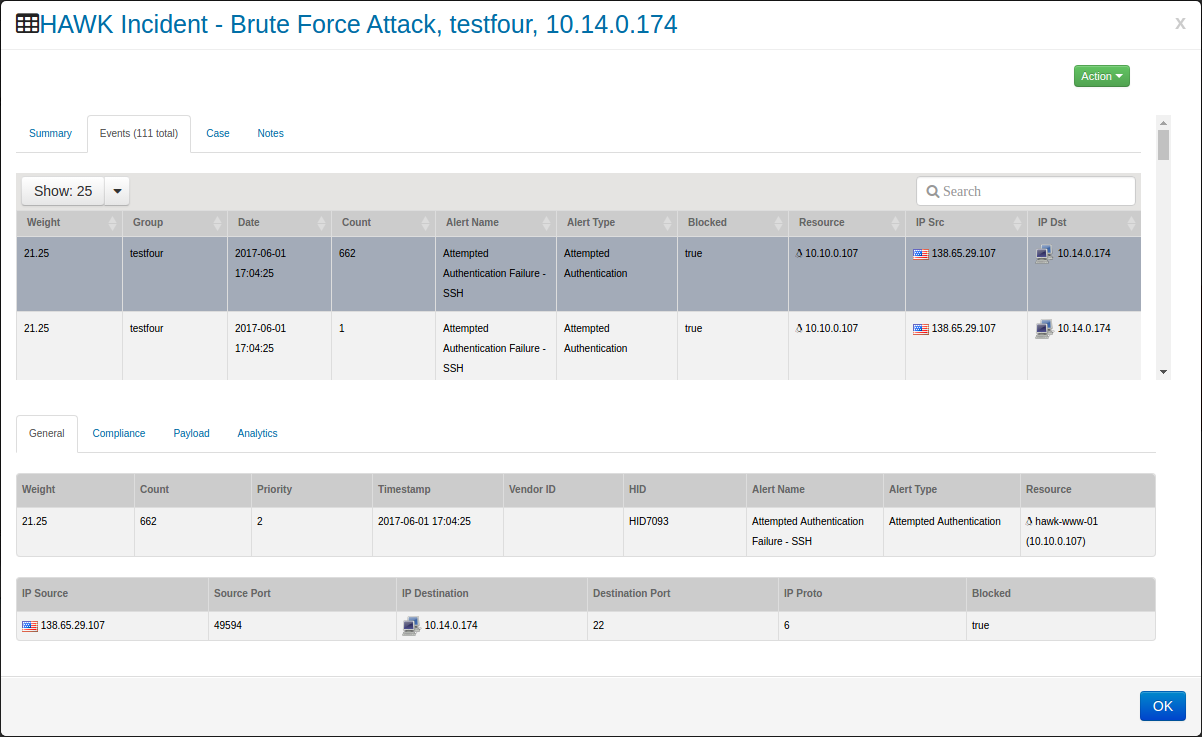
Notice in this window, there are four tabs at the bottom which provides even greater detail about the selected event. These four tabs are:
General - Shows the following information:
Weight
Count
Priority
Timestamp
Vendor ID
HID
Alert Name
Alert Type
Resource
IP Source
Source Port
IP Destination
Destination Port
IP Proto
Blocked
Additinal fileds may be present on IDS events:
IP Version
IP Header Length
IP ID
IP Offset
IP ITIL
IP Csum
Compliance - Any information regarding Compliance for this event is shown in this tab.
Correlation Username
Target Username
Audit Login
Audit Logoff
Audit Policy Change
Audit Log Change
Audit Object Access
Audit User Action
Audit System Action
Audit Session Status
Audit System Account Validation
Audit System User Account Change
Audit System Group Account Change
Payload - Shows the log that was received or shows the Hex Payload and the ASCII Payload.
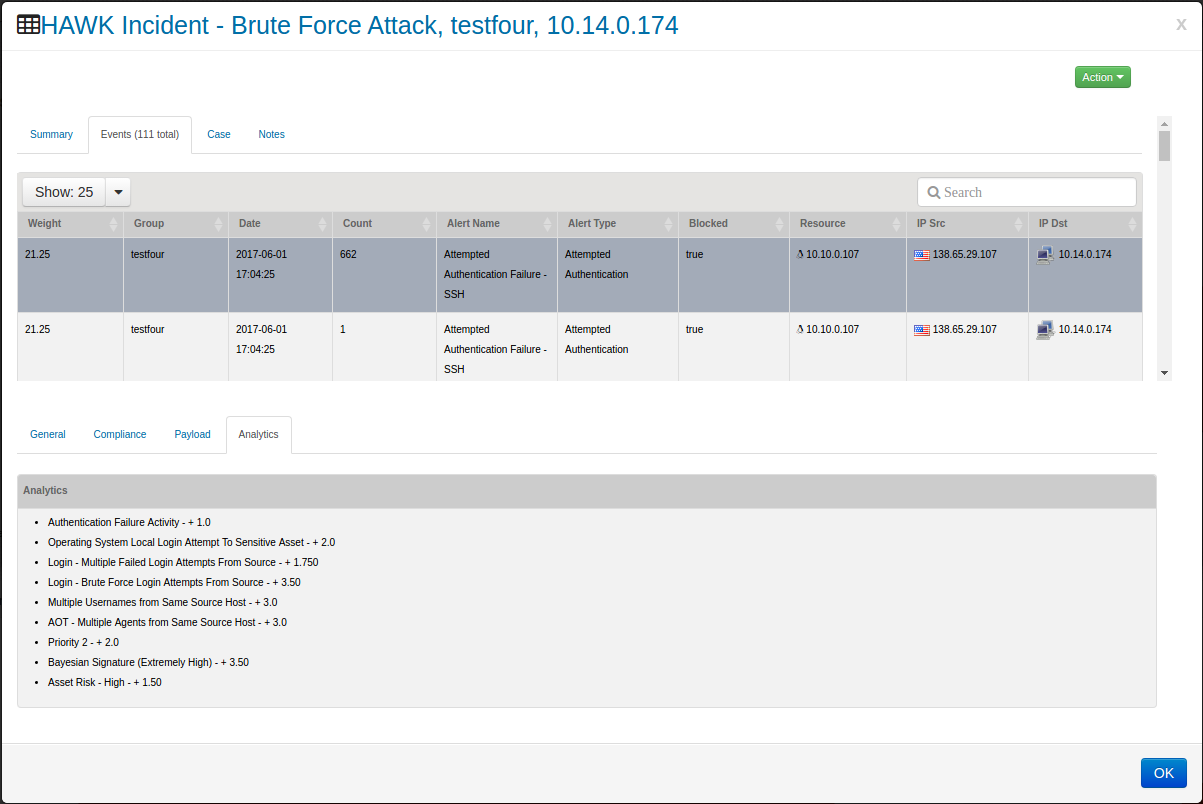
Analytics - Shows the Analytic rules that was associated with this specific event as shown below:

Click on Tab.
This will open the light weight case management window. Information here can help track and document working incidents and sharing information between team members.
The following information can be entered:
Case Name - A name to be assigned to the incident
Owner - The handler of the incident
Summary - A brief summary of the incident
Root Cause - Once the root cause is determined it should be entered here
Source Details - Details related to the source address
Destination Details - Details related to the destinations
Feedback - Feedback related to the incident
Feedback Comment - Details related to the feedback above
Corrective Action Plan - The Containment, Eradication, & Recovery process that will be used
Note
Click the Save button to save the changes made in the case.
Click on Tab.
This will open notes that have been applied to the incident. Each action performed on the incident will create an automatic note including a time stamp of the action. (e.g., Changing the owner, Changing the status)
To add a new note, enter a the note and click on the blue check box or hit enter.

Click on .
This allows the user to set the status of the event. The choices are:
New
Open
In Progress
Pending
False Positives
Closed
9.1.6. Exporting Incidents
When the details for an incident are show, these details can be exported to a spreadsheet, by following these steps:
On the navigation panel, click on
The Incidents Manager window opens:
Follow the steps in section ‘Drilling Down on the Incidents’ to get to the expanded list of incident details.
To export the Incident details, click on the
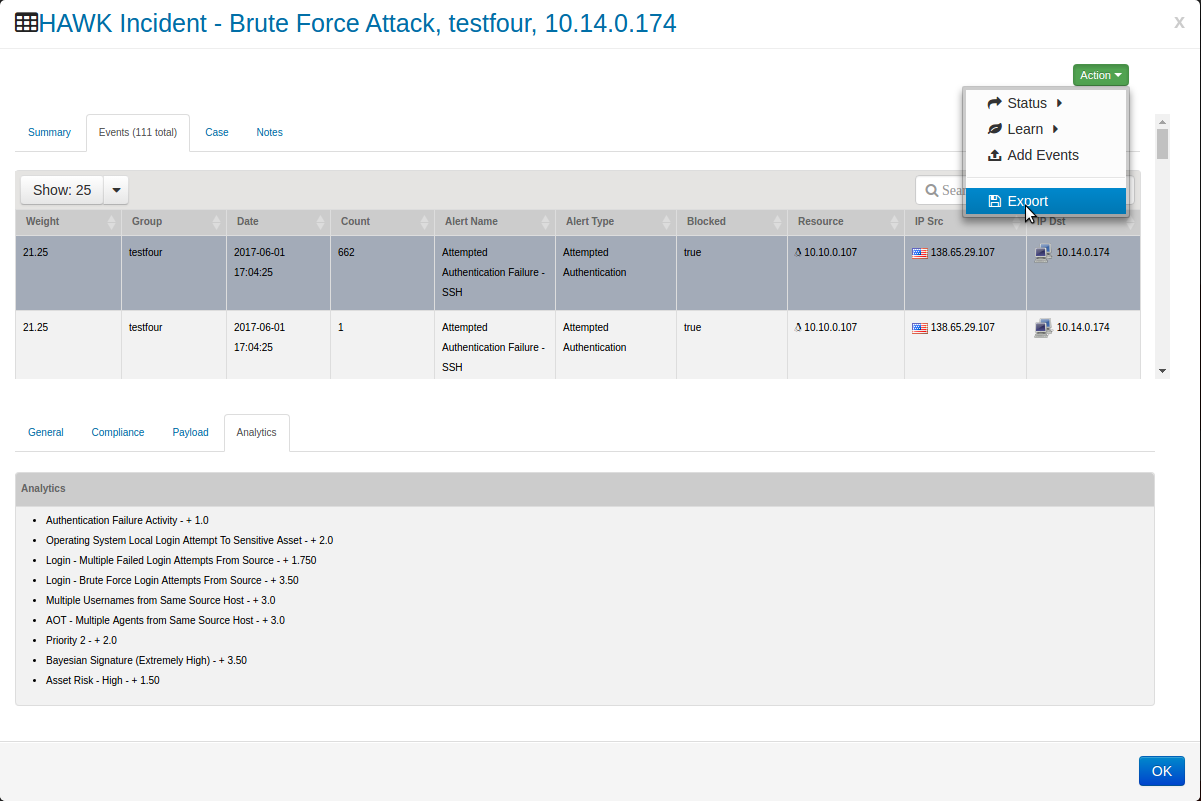
The window opens to select the export destination.
The system exports the data to the selected destination.